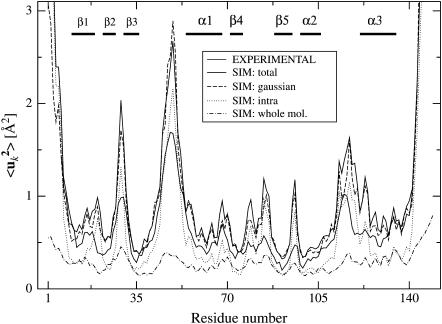
FIGURE 1.
Mean-square Cα-atom fluctuations calculated from the MD trajectories and from experiment. The simulation-derived fluctuations are: the total 〈uk2〉, including internal motion and whole-molecule translation and rotation (SIM: total); the total 〈uk2〉 with a Gaussian fit to the atomic positional distribution (SIM: Gaussian, see text); the contribution from internal motion (SIM: intra); and the contribution from whole-molecule translation and rotation (SIM: whole mol.). The decomposition of motions is described in detail in the text, see Eqs. 7 and 8. Experimental values were computed from B-factors using Eq. 6. B-factors were not reported in the starting structure used for the MD simulations (2SNS). Therefore, the experimental B-factors shown here are from 1STN (Hynes and Fox, 1991), a room-temperature structure refined at 1.7 Å with an R-factor of 0.162 and very similar unit cell parameters (a = b = 48.5 Å and c = 63.5 Å). Segments of secondary structures are indicated, see Fig. 8.

