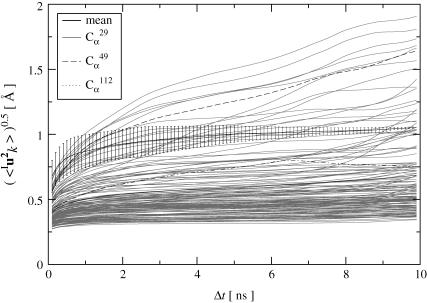
FIGURE 2.
Protein internal RMS fluctuations for all Cα-atoms averaged over subtrajectory lengths Δt (shaded lines) shown for a single protein of trajectory T1. Highlighted in black are the average overall Cα atoms and three examples of different time-dependence. Error bars denote the standard deviation. For clarity, only error bars for Cα29 are shown.

