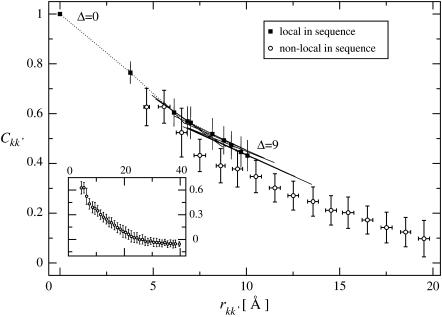
FIGURE 7.
〈Ckk′, Δt〉 versus 〈rkk′〉 for atom pairs local or nonlocal in sequence. For the local-in-sequence data error bars are drawn along the principal axes of each (Ckk′, Δt, rkk′)Δ-distribution. The dotted line connects data points for atom pairs that are local in sequence. The inset shows the non-local-in-sequence data over the full distance range and shows a profile similar to Fig. 4 A. Results are shown for trajectory T2 with a subtrajectory length Δt = 1.0 ns. Error bars denote the standard deviation.

