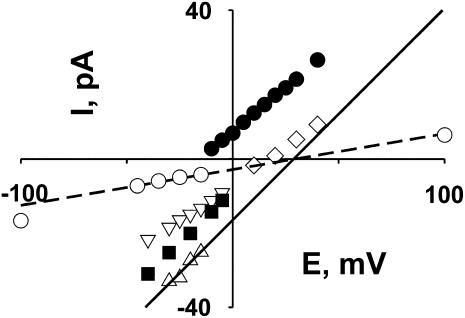
FIGURE 5.
Multiple cation conductance and selectivity states. Selectivity of each state was estimated by using the extrapolated reversal potentials. Graph represents I/V plots measured in the presence of 1:3 gradient of KCl (50 mM:150 mM) used for reversal potential determination for each selectivity state. All solutions were adjusted to pH = 7.4 (10 mM Hepes-Tris). Selectivity analysis was limited to the current levels, where typical small current fluctuations were observed, indicating the principal conductance state of the channel. Reversal potential was determined only for relatively stable states, when it was possible to measure the current level at several voltages over a range, with reasonable certainty that the channel did not exit to another state. Recording fragments used for such estimates are similar to ones shown in Fig. 4 A. Estimated values for the reversal potentials, and corresponding slope conductances, for the identified selectivity states are the following: anion-selective (•), −15 mV, 470 pS; cation-selective, +15 mV, 560 pS (▪); +16 mV, 370 pS (⋄); +21 mV, 350 pS (▿); ideally cation-selective, +29 mV, 560 pS (▵). Under these experimental conditions, the Nernst potential for potassium equals +28 mV. Ideally, cation-selective states were observed for both maximal conductance (▵) and lower-conductance (○) states; the lines are linear fits to the I/V relationships of these two states, as used for determination of reversal potentials.

