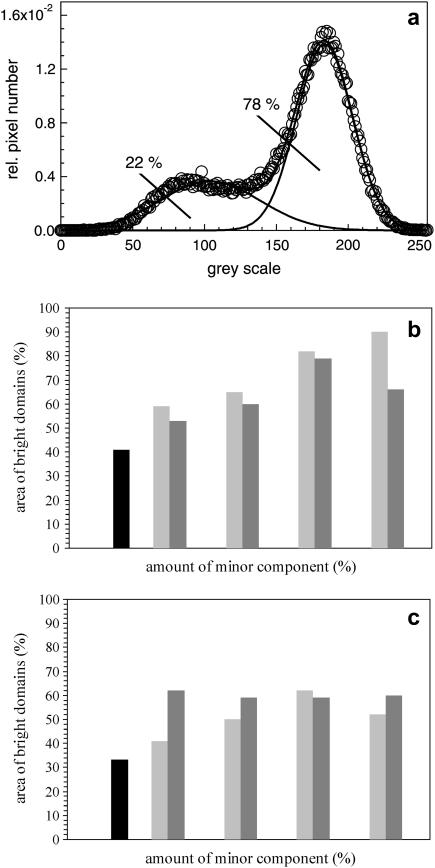
FIGURE 5.
Statistical analysis of FLM images at a surface pressure of 5 mN/m. (a) The areas of bright and dark domains were calculated by fitting the data to the sum of two Gaussian distributions. The Gaussian curve with an area of 78% represents the le phase, whereas the other one marks the dark domains with a total area of 22%. (b and c) Histograms of fluorescence light intensity of (b) DPPC/DPPG (80:20) and (c) DPPC/DPPG/SP-C (80:20:0.4) monolayers with various amounts of cholesterol/POPE. Model surfactant system in black, cholesterol-doped in light shaded, and POPE-doped in dark shaded.

