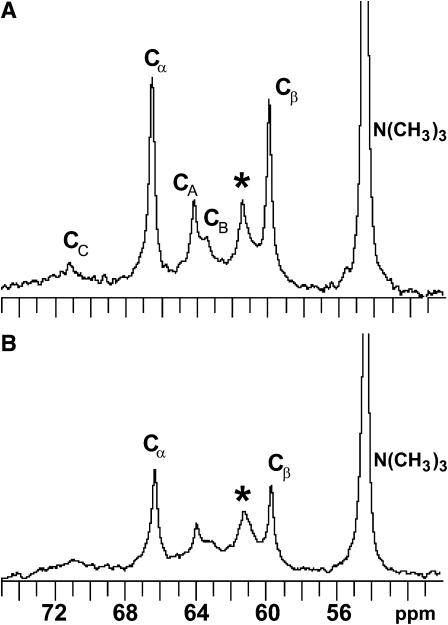
FIGURE 4.
13C-NMR spectra of POPC/DPPC/[6-13C]GalCer (49.5:49.5:1) vesicles in the absence (A) and presence (B) of 5 mM Mn2+. CA, CB, and CC indicate the resonances of the glycerol carbons, and Cα and Cβ indicate the phosphocholine headgroup resonances. The asterisk indicates the [6-13C] resonance of galactose.

