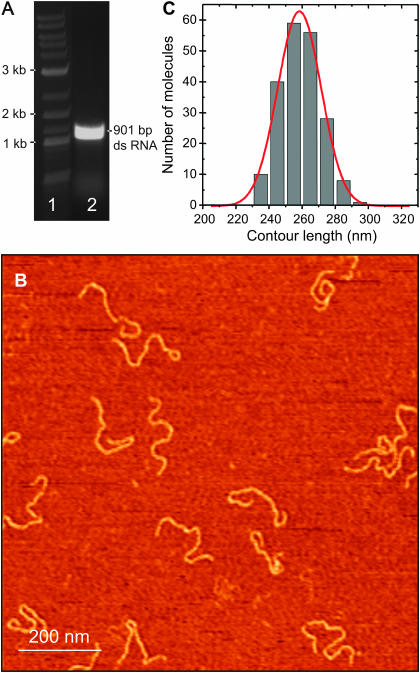
FIGURE 3.
(A) Gel electrophoresis (nondenaturing agarose, 0.75%) of 901 bp dsRNA molecules used in the AFM experiments. A reference dsDNA ladder is shown for comparison in lane 1. After the transcription reaction, we digested the products by both DNase I and an RNase mixture (lane 2). Digestion of the product by the RNase mixture ensures that single-stranded overhangs of the transcription product are removed. Hence, the single remaining band is dsRNA. (B) A 1 μm × 1 μm AFM image (256 × 256 pixels) of 901 bp dsRNA molecules deposited on mica using polylysine. (C) Distribution of lengths measured in the AFM for 901 bp dsRNA molecules. We measured a mean contour length of 258 ± 26 nm, corresponding to a rise per basepair of 0.29 ± 0.03 nm.

