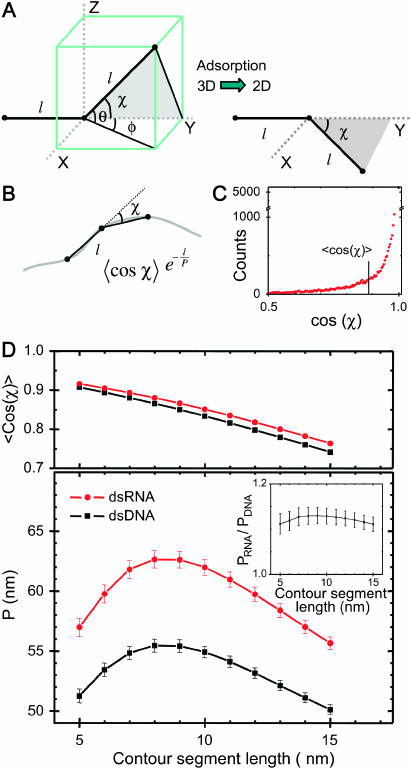
FIGURE 4.
Local curvature analysis of 935-bp dsDNA molecules and 901-bp dsRNA molecules adhered to a mica substrate by polylysine. (A) Each molecule is viewed as being composed of segments of length l. The angle in 3D between such segments is defined as χ. We postulate that this relative angle between segments is maintained upon adsorption of the molecule onto the surface, which yields a simple equation for the measurement of P for kinetically trapped molecules (Eq. 4). (B) Depiction of a molecule in 2D, with the angle χ between segments of length l indicated. We have measured the distribution of angles χ as a function of the contour segment length l. (C) Distribution of  for l = 8 nm for dsRNA molecules. Similar distributions were obtained for dsDNA. The average value of this distribution (marked with a black line) is used to determine the persistence length according to Eq. 4. (D) Top: value of
  for dsDNA (black squares) and for dsRNA (red circles) as a function of contour segment length l. Bottom: From
  , a value of the persistence length can be determined as a function of l using Eq. 4. The persistence lengths of dsDNA (black squares) and dsRNA (red circles) are plotted as a function of l. A clear maximum can be discerned for both dsDNA and dsRNA, which we attribute to the correct values of the persistence lengths of these molecules. Inset: the ratio of the persistence length of dsRNA to the persistence length of dsDNA is nearly constant as a function of l, indicating the robustness of the technique.

