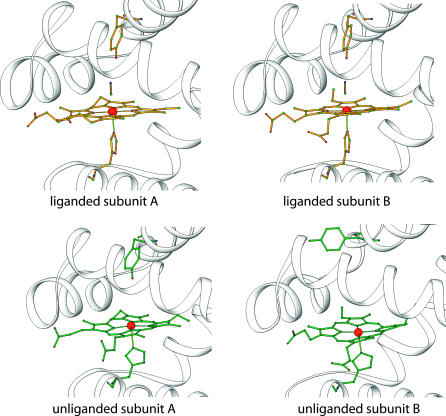
FIGURE 1.
Diagrams of the heme regions of the HemAT sensor domain. The proteins are drawn as ribbons and residues Tyr-70, His-123, heme groups, and ligands are represented as ball/stick models. The top panels show liganded HemAT sensor domain and the bottom panels show unliganded structure. The Protein Data Bank access codes for the two structures are 1OR4 and 1OR6.

