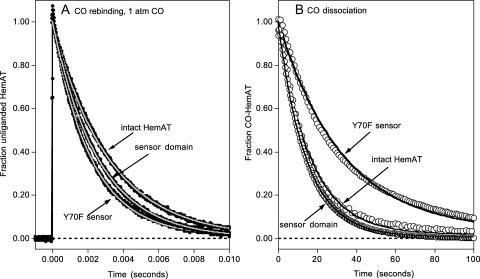
FIGURE 9.
Time courses for CO association with and dissociation from full-length HemAT, wild-type sensor domain, and the Y70F sensor domain mutant at pH 7.0, 25°C. (A) CO rebinding after laser photolysis at [CO] = 1000 μM. Time courses were measured at 436 nm (black lines and circles) and fitted to single exponential expressions (gray lines) with observed rates of 35 s−1, 38 s−1, and 47 s−1 for full-length HemAT, wild-type sensor domain, and the Y70F mutant, respectively. (B) Time courses for CO dissociation were obtained by mixing 3–8 μM protein in 100 μM CO with anaerobic buffer containing 2000 μM NO. Under these conditions, the observed replacement rate is directly equal to the rate of CO dissociation, kCO. Time courses were recorded at 422 nm (○) and fitted to single exponential expressions (solid lines) with observed rates equal to the kCO values in Table 1. As shown in panel B, the time course for CO dissociation from the Y70F (and the other mutants (Y70L and Y70W) not shown due to superimposition on these for Y70F) is better fit to a multiple exponential expression. However the differences in the fast and slow component rates are less than a factor of 3 and very small compared to the 20-fold differences seen in the O2 dissociation time courses (Fig. 7 and Table 1).

