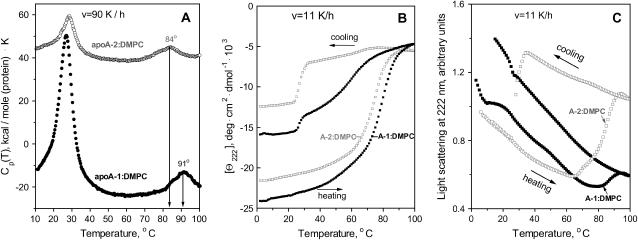
FIGURE 6.
Thermal unfolding of apoA-1 and apoA-2 in DMPC complexes. (A) Excess heat capacity Cp(T) of DMPC disks with apoA-1 (•) and apoA-2 (○) recorded by DSC during heating at 90 K/h. The data are shifted along the y axis to avoid overlap; the peak positions of the protein unfolding transition are indicated. (B) CD melting curves Θ222(T) and (C) light-scattering data of the disks recorded simultaneously during heating and cooling at 0.193 K/min (11 K/h). Standard buffer solutions containing 0.7 mg/ml protein (in DSC) and 20 μg/ml protein (in CD and light-scattering experiments) were used.

