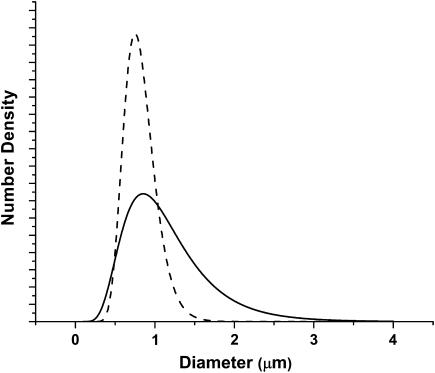
FIGURE 7.
Particle size distributions obtained from the fits to the scattering data from whole cells (solid line) and isolated mitochondria (dashed line). The peaks of these two distributions are 0.89 and 0.85 μm, respectively, and the corresponding means are 1.15 and 0.89 μm. Number densities are in units of particles per unit volume.

