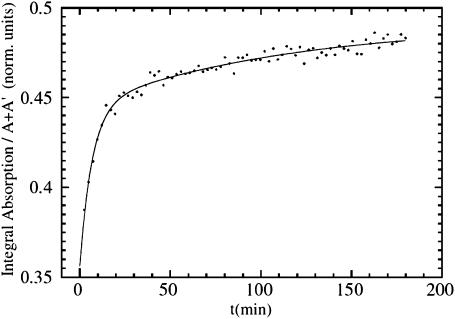
FIGURE 3.
Evolution of the integrated XANES signal between the A and A′ peaks as a function of the illumination time for MbCO at 15 K under extended illumination by white light. The solid line is a fit using two exponentials, (a*(1−exp(−t/t1))+(1−a)*(1−exp(−t/t2))). The faster component is assigned to Fe-CO photolysis, the slower component to light-induced Fe-heme relaxation.

