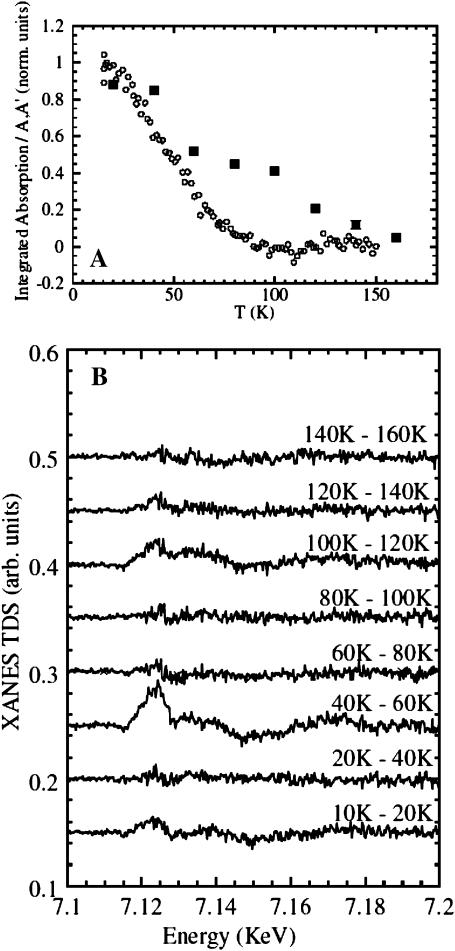
FIGURE 5.
(A) CO recombination after preparation of different photoproducts while ramping the temperature up at 1.2 K/min, as measured from the XANES signal ΔAA′(T) integrated between 7.12 and 7.125 keV. Each point in the panel was calculated as ΔAA′(T)/ΔAA′max. (Open circles) Recombination after extended illumination at T = 15 K; (solid squares) recombination after slow-cool illumination. (B) XANES difference spectra (XANES-TDS) upon recombination after slow-cool illumination, from 10 K to 160 K.

