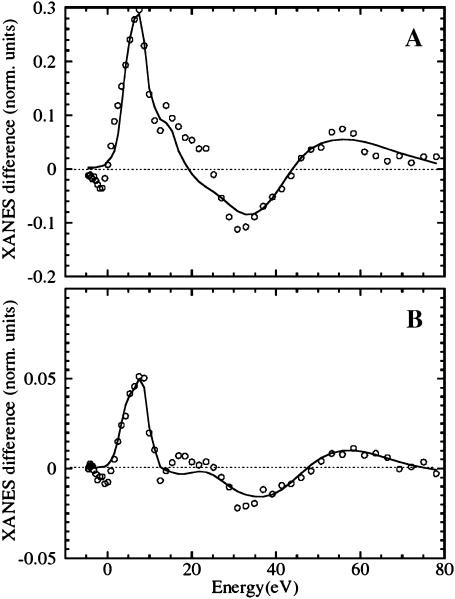
FIGURE 7.
Theoretical XANES fits (solid lines) of the experimental difference spectra (open circles) obtained as follows: (A) before and after extended illumination at 15 K (B-relaxed state, Fit 2 of Table 1) and (B) The photoproduct at 10 K, and after rising temperature at 80 K in the dark, after slow-cool illumination (B state, Fit 5 of Table 1). The extracted structural parameters are depicted for clarity in Fig. 8.

