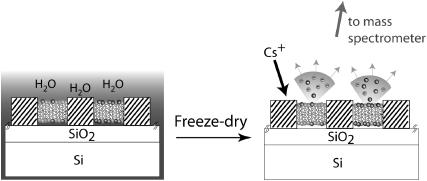
FIGURE 1.
Cross-sectional schematic of a patterned lipid bilayer with different compositions in each corral as prepared under water (not to scale; the SiO2 layer is typically 40 nm thick and barriers are separated by tens of microns). After freeze-drying to remove the bulk water, its composition is sampled by secondary ion mass spectrometry using a Cameca NanoSIMS 50 instrument. The incoming focused Cs-ion beam generates secondary ions; negative ions are collected and analyzed in a high-resolution mass spectrometer (not shown). The identities of different components are encoded by isotopic or atomic labeling.

