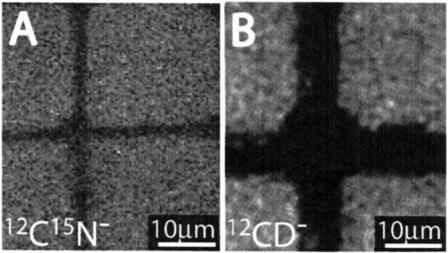
FIGURE 4.
SIMS data of isotopically labeled lipids patterned with a fibronectin grid. (A) 12CD− signal of D31-POPC. (B) 12C15N− signal of 15N-egg PC with 0.5 mol % TR-DHPE, where the protein stamp was wider than the one used in A. The contrast of both images is substantially higher than the natural abundance of D and 15N, clearly demonstrating that lipid bilayers can be detected, imaged, and their compositions analyzed. The total dwell times were 8 ms and 2 ms, respectively.

