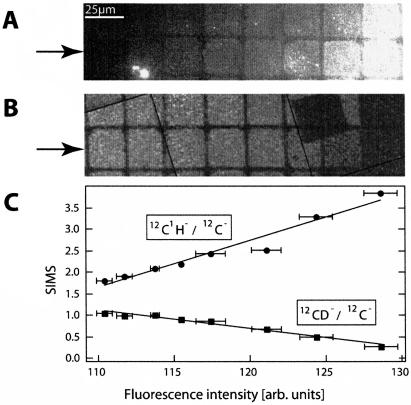
FIGURE 5.
Analysis of a bilayer compositional array by fluorescence and secondary ion signals collected by the NanoSIMS 50. A gradient between egg PC (containing 0.5 mol% TR-DHPE) and D31-POPC was formed by depositing one droplet of each of two different vesicle suspensions (egg PC and D31-POPC) onto a FN-patterned surface. (A) Fluorescence image showing the variation in composition, from low fluorescence to high fluorescence. (B) 12CD−/12C− SIMS signal from the same region shows the 12CD−/12C− signal is maximal where the fluorescence is minimal (the total dwell time was 8 ms). (C) Normalized 12CD−/12C− and 12C1H−/12C− signals versus the fluorescence, where each of the eight data points on each line corresponds to one of the eight corrals within the lower row highlighted with arrows in panels A and B. The best fit to a linear relationship is plotted through the points.

