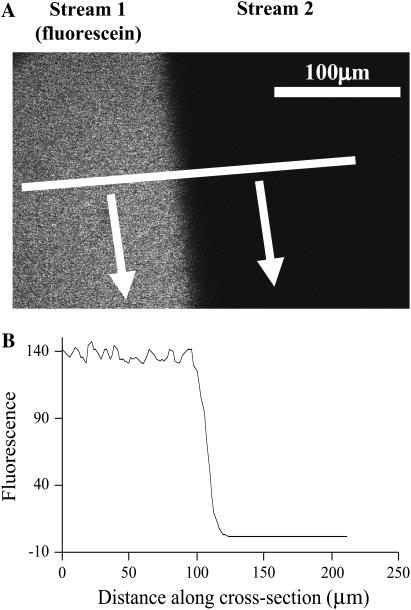
FIGURE 1.
Dual microperfusion. (A) Confocal imaging (excitation wavelength 488 nm) of two microstreams emerging from the double-barreled micropipette. The left-hand side microstream contained 100 μM fluorescein (emission wavelength 510 nm). No fluorophore was included in the right microstream. Arrows indicate direction of solution flow. Horizontal white line shows distance over which the fluorescence profile in panel B was measured. (B) The longitudinal fluorescence profile (arbitrary units) plotted perpendicular to the microstream boundary suggests a boundary width <10 μm (measured as the distance between 5 and 95% signal).

