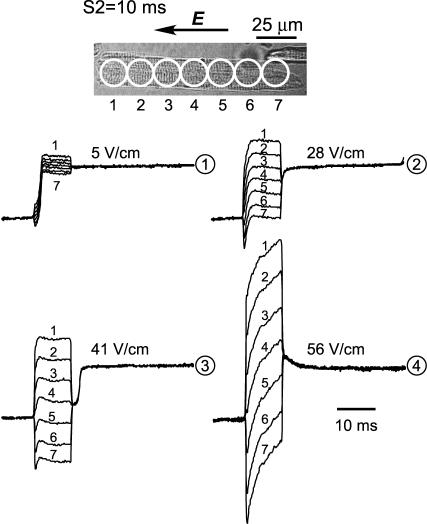
FIGURE 1.
Cell excitation with 10 ms duration pulses. The cell shown was stimulated in the indicated direction with S1 pulse of 10 ms and variable amplitude, and Vm responses were optically recorded from seven sites spaced equally along the cell length. The four sets of recordings show Vm responses for the various S1 pulses. The numbers beneath and above the S1 portion of the recordings indicate the site number to which that trace corresponds. The amplitude of the S1 pulses is shown alongside the recordings. The circled numbers on the right of the traces indicate the sequence in which the recordings were obtained. The time bar for all recordings is shown alongside the 56 V/cm traces.

