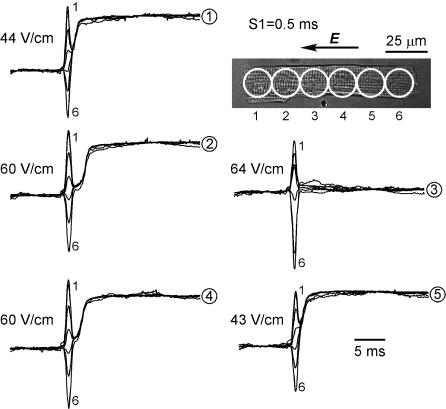
FIGURE 2.
Loss of excitation for 0.5 ms pulses. The cell shown was stimulated with a series of 0.5 ms pulses of variable amplitude. The cell could be excited with 44 and 60 V/cm pulses but not with the 64 V/cm pulse. Excitation was restored when field strength was decreased back to 60 and 43 V/cm. The circled numbers on the right of the traces indicate the sequence in which the S1 pulses were applied. Also indicated are the recordings corresponding to sites 1 and 6. The time bar shown for the 43 V/cm recordings is common to all five sets of traces.

