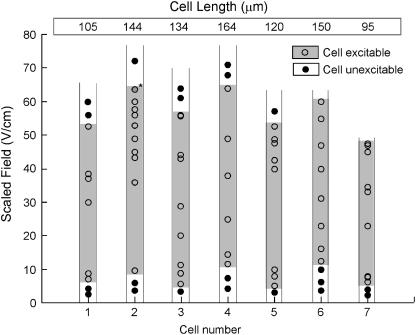
FIGURE 5.
Summary of data for seven cells stimulated with short (0.5 and 1 ms) pulses. The zone of excitation and lack thereof for each of the seven cells is shown individually. Each circle represents an applied field stimulus. Open circles represent the field stimuli for which excitation occurred, and solid circles represent the fields for which a cell failed to excite. For cell 2, the data point with an asterisk represents the stimulus corresponding to trace 3 of Fig. 3 for which excitation occurred after a considerable delay from the stimulus pulse. Note that the ordinate is the scaled electric field and represents an equivalent field experienced by a 120-μm long cell, which is the nominal length of a guinea pig cell. Cell lengths for various cells are shown at the top of the plot.

