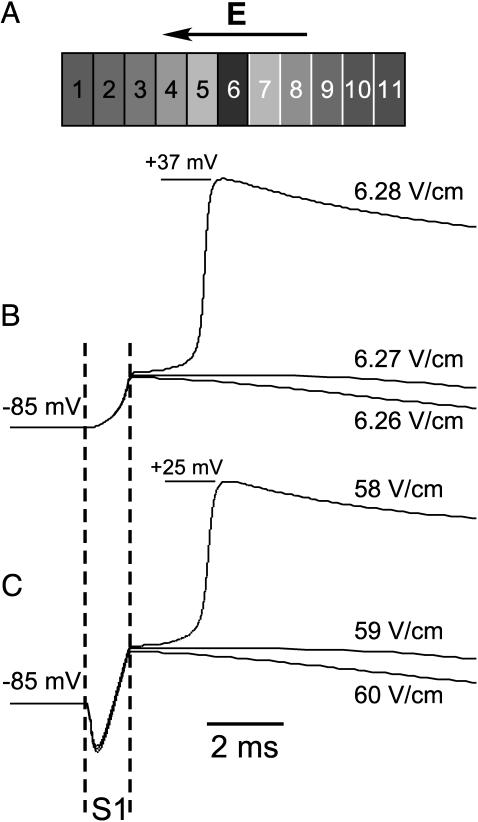
FIGURE 6.
Responses of a model cell for 1 ms pulses near the LLE and near the ULE. Panel A shows the schematic of the model cell divided into 201 equal sized patches, but for simplicity only 11 (every one in 20 patches) are shown. Panel B shows the response of the central patch to three low amplitude pulses near LLE. Panel C shows the superimposed responses from the same patch for three pulses near ULE. The cell was excited with 58 V/cm but not with 59 and 60 V/cm pulses. The takeoff potential for 6.28 and 58 V/cm pulses is the same (∼−55 mV) and is equal to the Na+ channel activation threshold. However, the overshoot potentials are different (+37 and +25 mV, respectively).

