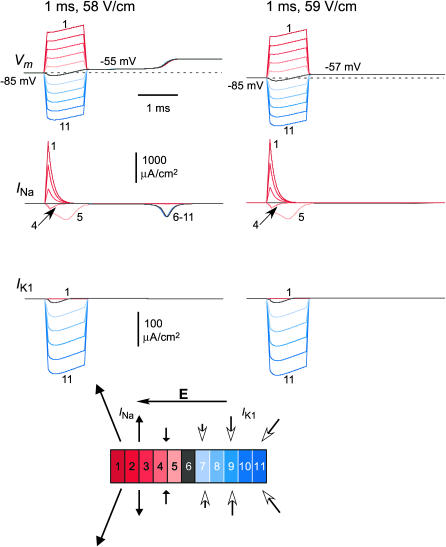
FIGURE 8.
Paradoxical loss of excitation in a model cell for fields near ULE. The left column shows Vm, INa, and IK1 for the 11 patches of the model cell for a 58 V/cm, 1 ms field pulse. The right column shows Vm, INa, and IK1 for a pulse also of 1 ms duration but with amplitude increased to 59 V/cm. The numbers indicate the patch numbers to which various traces correspond. For clarity, only traces from the end patches are numbered for Vm and IK1. For INa, intermediate patches with complex temporal behavior are also indicated. Time bar is applicable to all sets of traces. INa and IK1 amplitude bars are applicable to both 58 and 59 V/cm traces. At the bottom is a schematic cell that shows the flow of INa and IK1 in the various patches. The various arrows signify the relative amplitudes of the corresponding currents. The simulations in this figure are the same as in Fig. 6 C.

