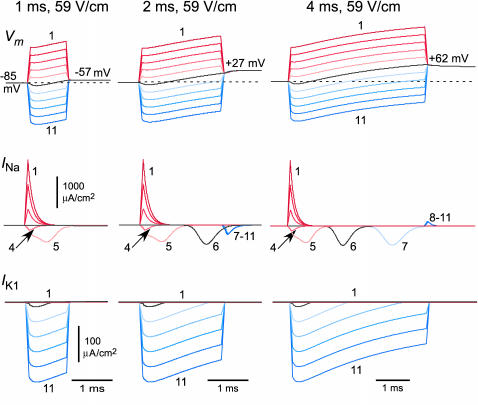
FIGURE 9.
Return of excitation with increasing pulse duration. Left, middle, and right columns show Vm, INa, and IK1 for three pulses of equal amplitude (59 V/cm) but increasing duration (1, 2, and 4 ms, respectively). The cell was unexcited for a pulse duration of 1 ms but excited with 2 and 4 ms pulses. For clarity, only traces from the end patches are numbered for Vm and IK1. For INa, intermediate patches with complex temporal behavior are also numbered. Time bar in each column is applicable to all sets of traces at that duration. INa and IK1 amplitude bars are applicable to all three durations.

