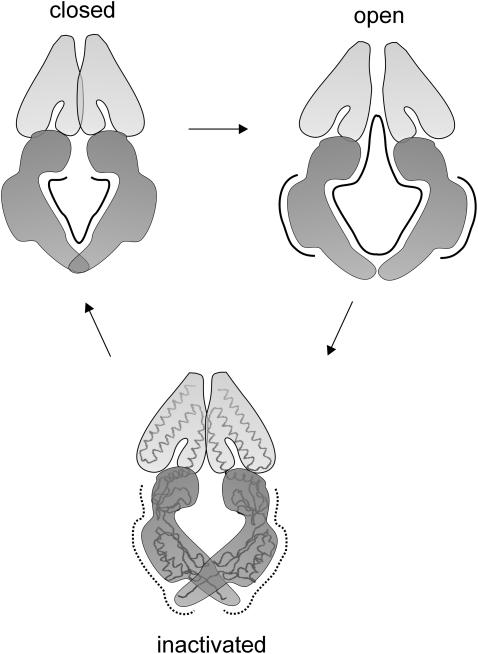
FIGURE 8.
MscS surface areas change upon transitions between different conformational states as revealed by the channel behavior in the presence of cosolvents. Solid lines indicate the surfaces that expand upon transitions, and dotted lines those that shrink. Activation is associated with an increase of the outer and inner surfaces of the channel including the gate. The area of external surfaces of the channel decreases when it inactivates. Upon closure of the channel, the area of its inner surface decreases. The crystal form of MscS represents here the inactivated state.

