Figure 4.
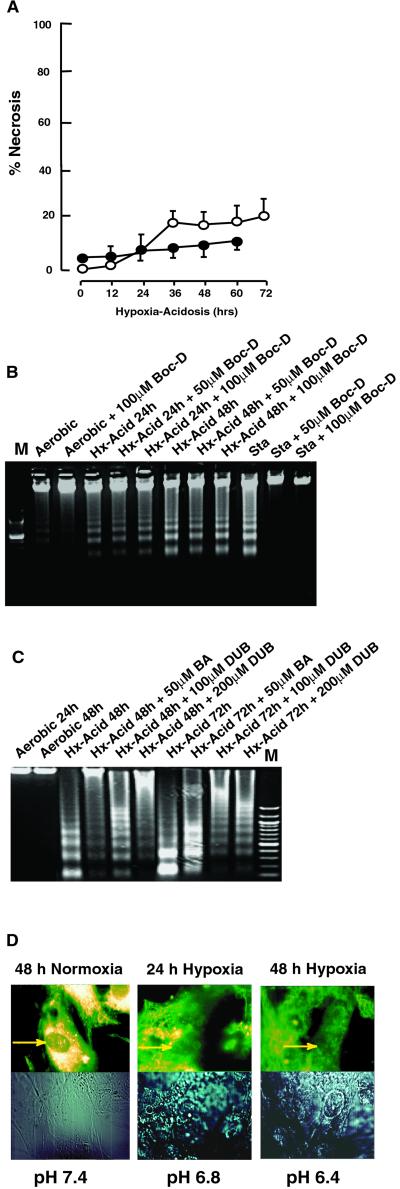
Characteristics of programmed cell death by BNIP3. (A) Cardiac myocytes were subjected to hypoxia-acidosis as described in Fig. 1. At the indicated times, samples of media were taken for analysis of LDH activity (open circles) or plates were stained with trypan blue (closed circles). Data are expressed as percent of cells stained with trypan blue or percent LDH released relative to total LDH in homogenates. (B) Cardiac myocytes were subjected to hypoxia-acidosis in the absence or presence of the broad-range caspase inhibitor Boc-D, as indicated. Staurosporine (Sta; 1.0 μM for 8 h) is shown as a positive control. (C) Cardiac myocytes were subjected to hypoxia-acidosis in the absence or presence of the MPTP inhibitors BA or DUB, as indicated. (D) Cardiac myocytes were exposed to normoxic or hypoxia-acidosis conditions. At the times indicated, cells were loaded with MitoTracker Red dye and analyzed by confocal microscopy. Arrows indicate intense staining around nuclei in aerobic myocytes and reduced/diffuse staining under hypoxia. Results are representative of three experiments.

