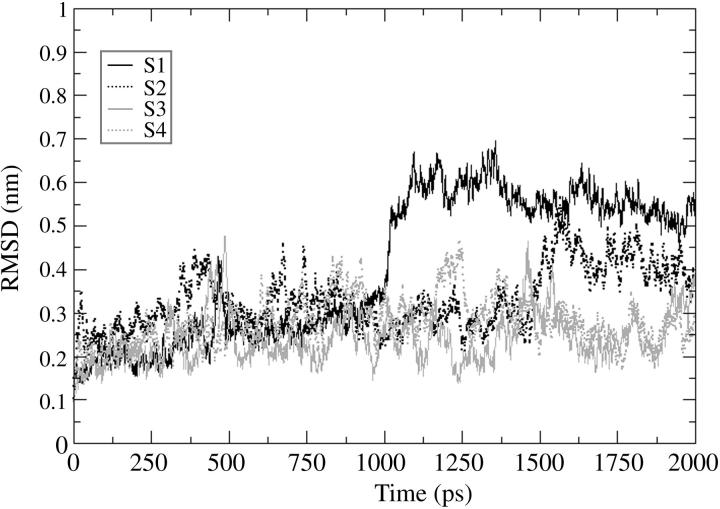
FIGURE 3.
Root-mean-square deviation of the backbone atoms of the catalytic loop (residues 138–149) as a function of time with respect to the equilibrated conformation (0 ps). S1 stands for simulation 1 (black solid line); S2 stands for simulation 2 (black dotted line); S3 stands for simulation 3 (gray solid line); and S4 stands for simulation 4 (gray dotted line).

