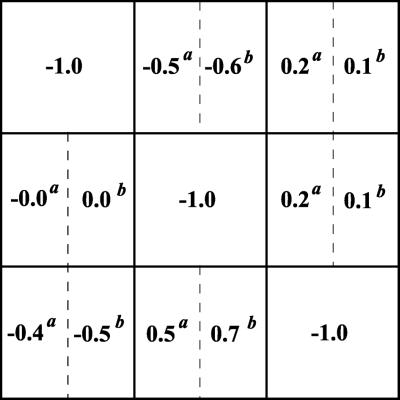
Figure 10.
Interaction maps retrieved from incomplete data. Two experimental local interaction matrices (r) were retrieved from the global response matrix corresponding to the first three rows and columns of the matrices shown in Fig. 7. The response coefficients marked by superscripts a or b correspond to perturbations indicated in the legend to Fig. 7.

