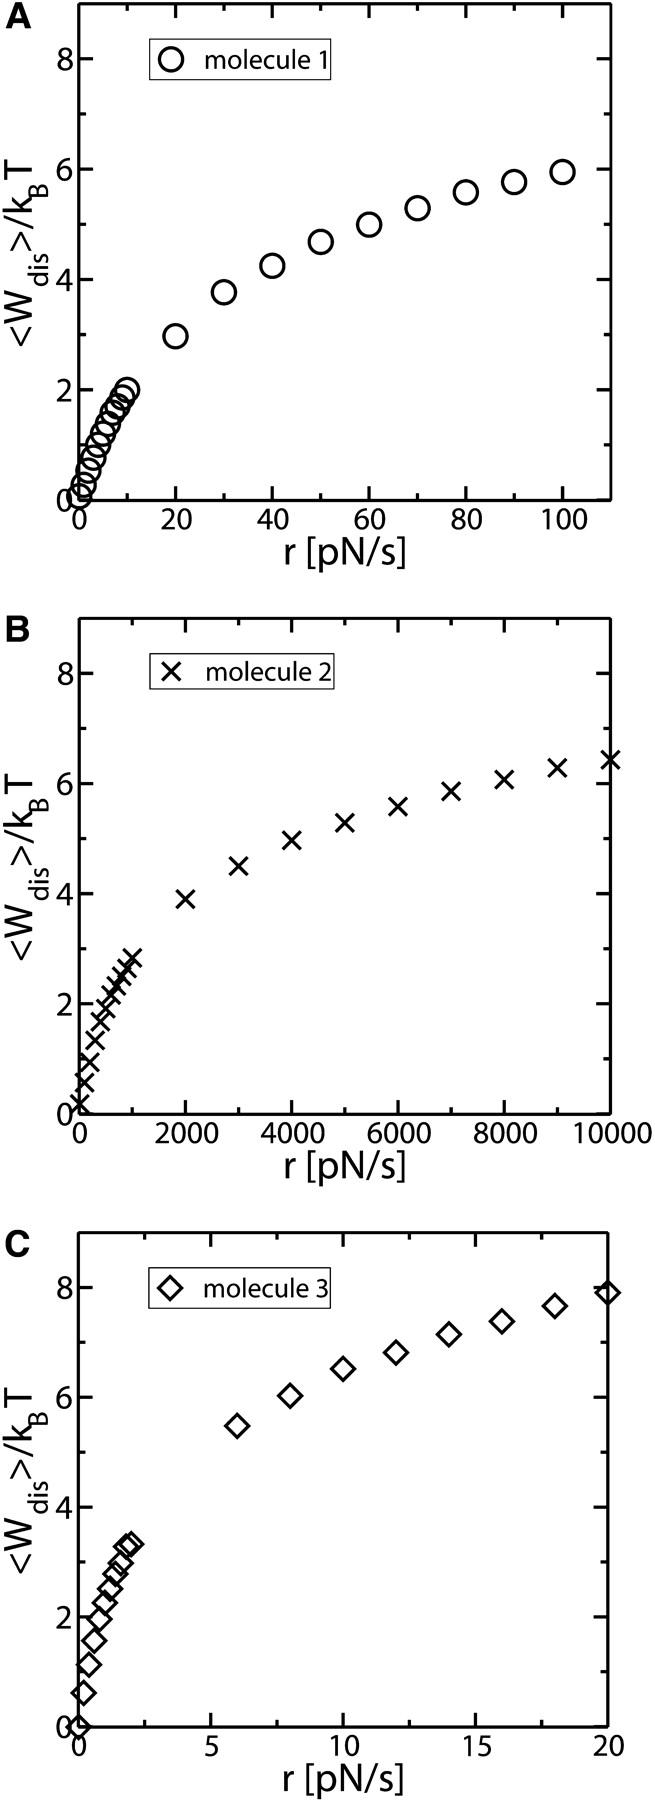
FIGURE 12.

Mean dissipated work as a function of the loading rate r for Molecule 1 in A, for Molecule 2 in B, and for Molecule 3 in C. The characteristics for the three molecules are given in Fig. 11. Note that the regimes studied are far from the linear response regime, as the curves deviate from straight lines. Deviations from the linear response regime arise in the range of r-values where the fraction N approaches zero (Fig. 11 A).
