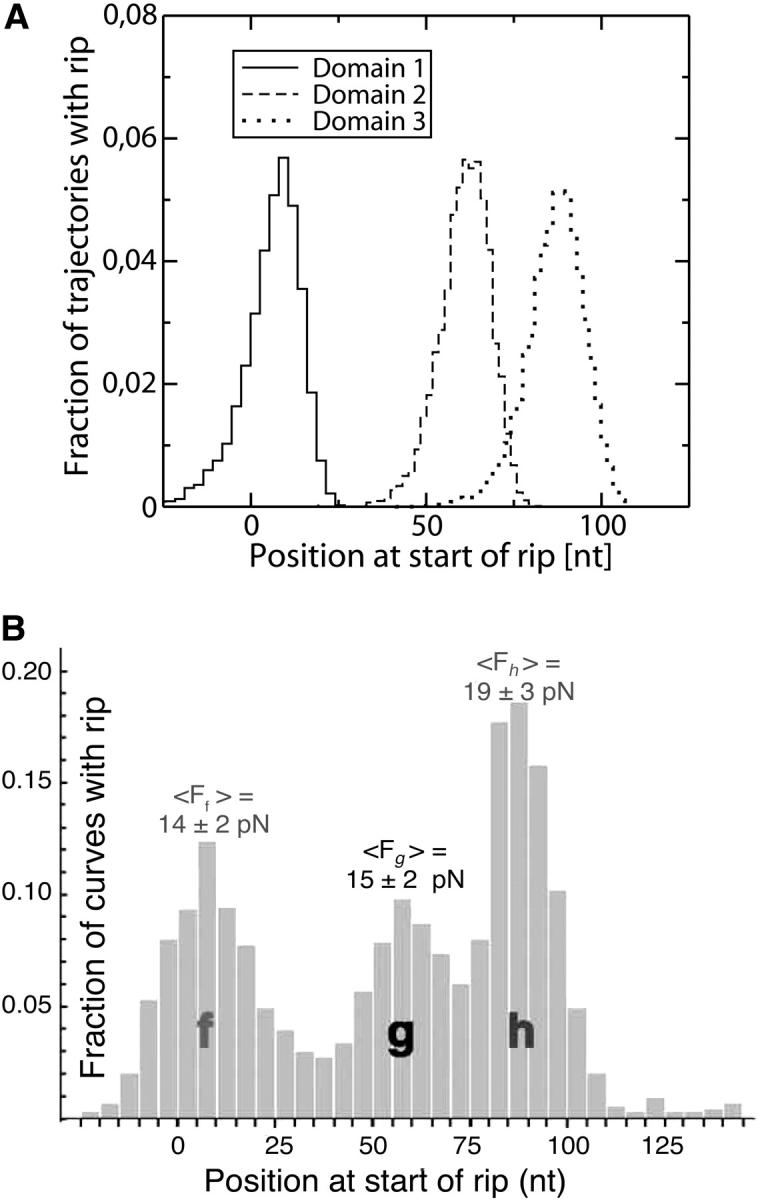
FIGURE 16.

Comparison between model and experiments of the rip position distribution. The position of the rip (abscissa) is represented in units of nucleotides. (A) Histograms for the positions at the start of the detected rips obtained from the simulation. They correspond to the three transitions observed in Fig. 15 A. The parameters used in the simulation are given in Fig. 15 A. (B) Experimental histograms of rips detected in 732 unfolding curves of P4–P6 (Fig. 15 B). Figure taken from Onoa et al. (2003).
