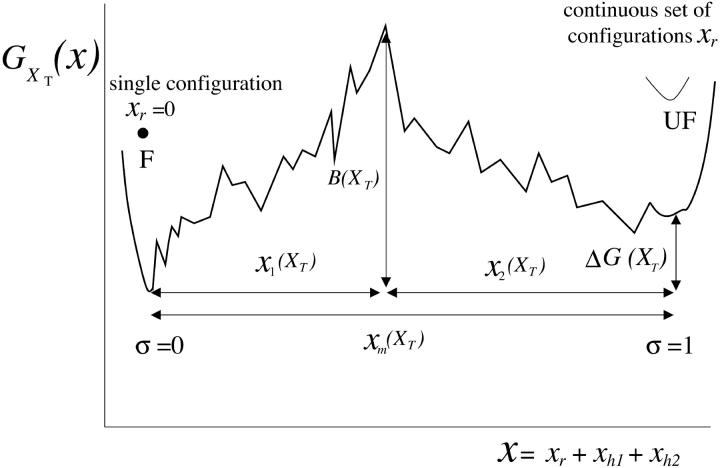
FIGURE 2.
Schematic representation of the free-energy landscape,  for the whole system at temperature below the melting temperature, for
  (where
  is the value of XT, in which both states F and UF are equiprobable) and normal ionic conditions. For this set of conditions, the stable state is the folded one. In this figure we represent all the parameters characterizing the two-states model. We also show the relevant configurations in the F and UF states along the reaction coordinate xr: the F state is characterized by a single configuration xr = 0, whereas the UF state is represented by a continuous set of values of xr. We use the label σ = 0 for the F state and σ = 1 for the UF state.

