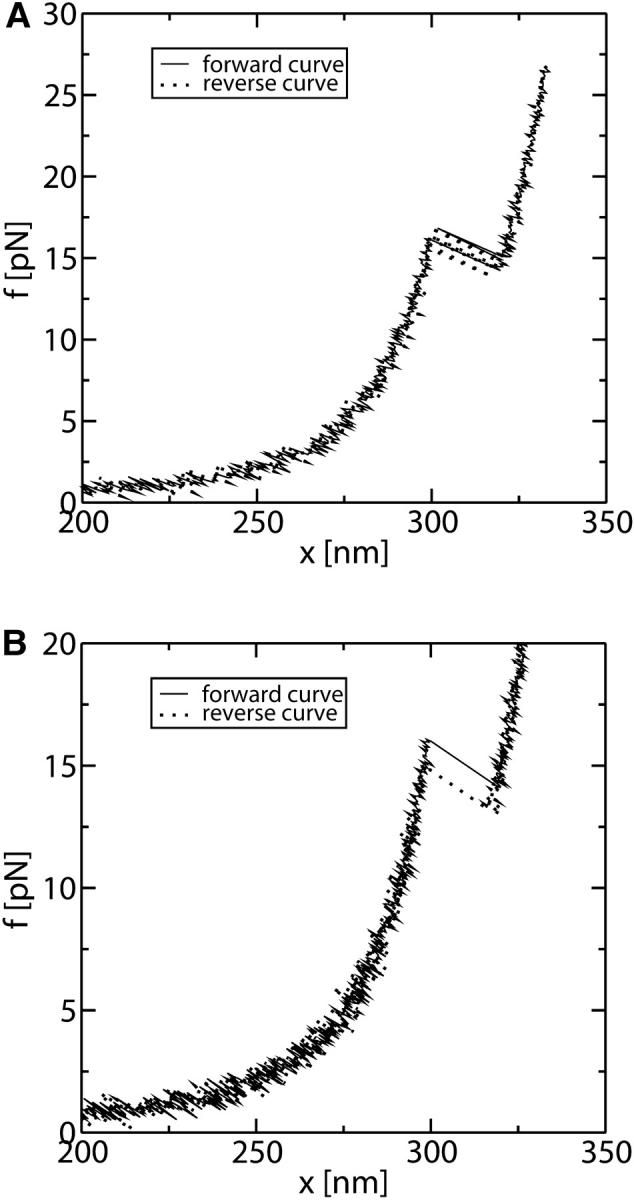
FIGURE 7.

Results for the FEC obtained from the simulation of a pulling experiment with iteration time Δt = 10−2 s. (A) Pulling rate r = 1 pN/s. (B) Pulling rate r = 50 pN/s. At this pulling rate the molecule is driven out of equilibrium, and hysteresis is observed around the transition.
