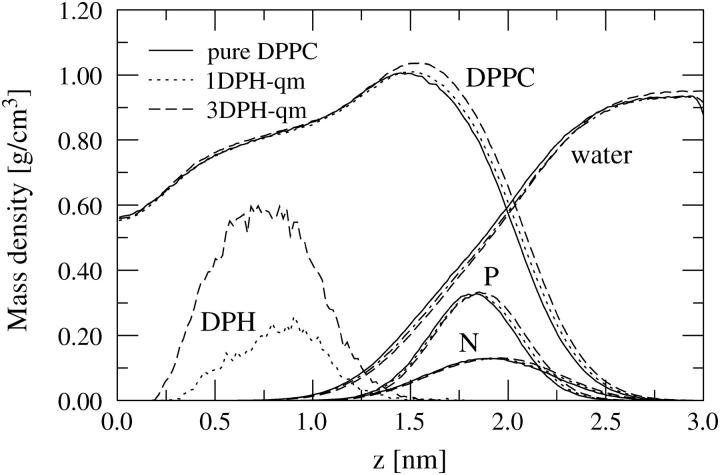
FIGURE 10.
Mass density profiles of different molecular components across the bilayer. The point z = 0 corresponds to the center of the bilayer. The profiles of phosphorous and nitrogen atoms have been multiplied by a factor of 2.5 and 3, respectively, and the profiles of DPH (for its CM) have been multiplied by 30. The profiles of 1DPH-0 and 3DPH-0 were essentially similar to those of 1DPH-qm and 3DPH-qm, in respective order.

