
FIGURE 4.
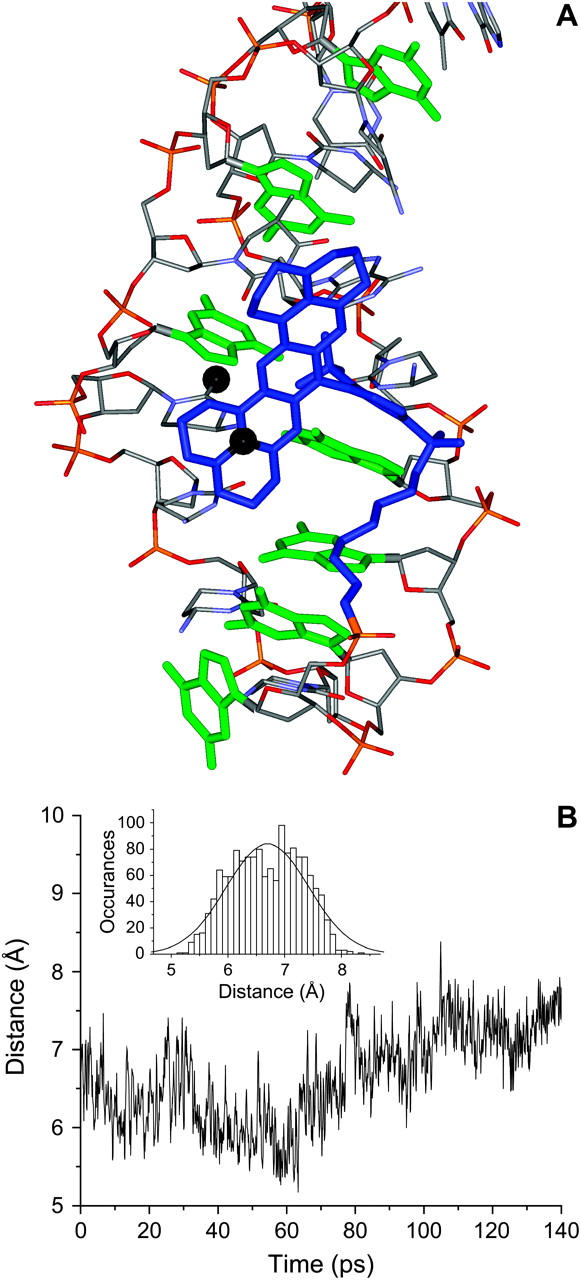
(A) Final molecular dynamics structure of the Texas Red-aptamer complex. Texas Red is blue and aptamer is colored by atom. Guanosine bases are shown in green. The dye and guanosine bases are shown in bold. Hydrogen atoms have been removed for clarity. A nitrogen on the dye and an oxygen on the nearby DNA base are shown as black balls. (B) The distance between these atoms as a function of time for the molecular dynamics run. (Inset) Histogram of the distances shown in panel B and a Gaussian fit of that histogram (curve).