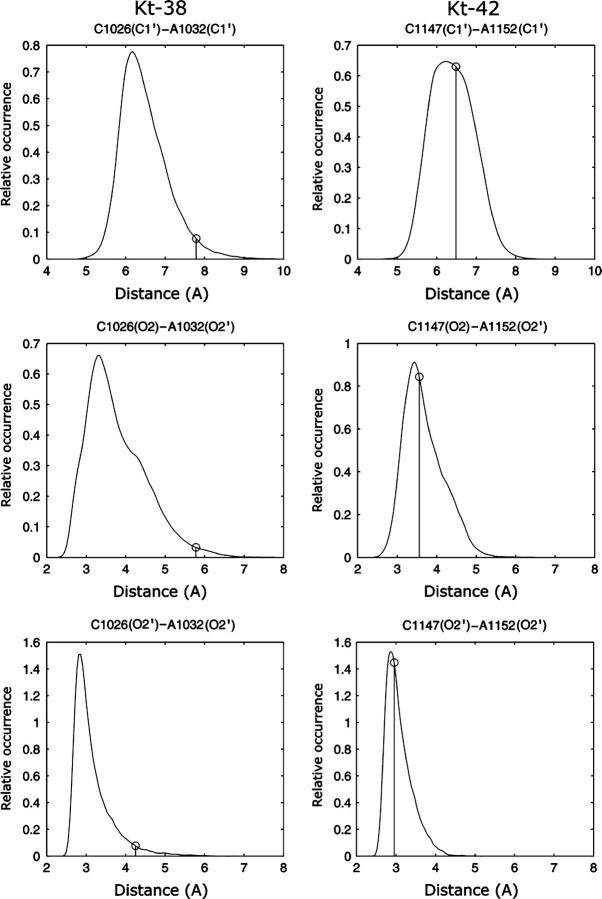
FIGURE 3.
Normalized histograms of interatomic distances involving the second conserved adenosine in the NC-stem and the cytosine of the first basepair of the C-stem in simulations of Kt-38 (left) and Kt-42 (right). Vertical lines indicate values in the crystal structure of the H. marismortui 50S subunit.

