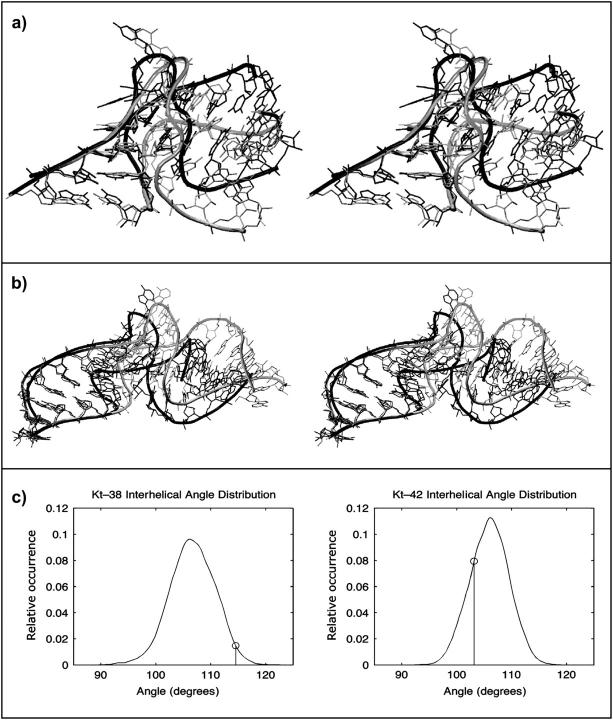
FIGURE 6.
Superposition of 3D structures of closed and open structures for (a) Kt-38 and (b) Kt-42. The crystallographic structures are shown in black (open for Kt-38 and closed for Kt-42, see text) and representative simulated structures are shaded. (c) Normalized histograms of the interhelical angles calculated as described in the Methods section. The asymmetric shape of these distributions corresponds to open/closed dynamics of Kt-38 and Kt-42. The vertical lines indicate the x-ray values.

