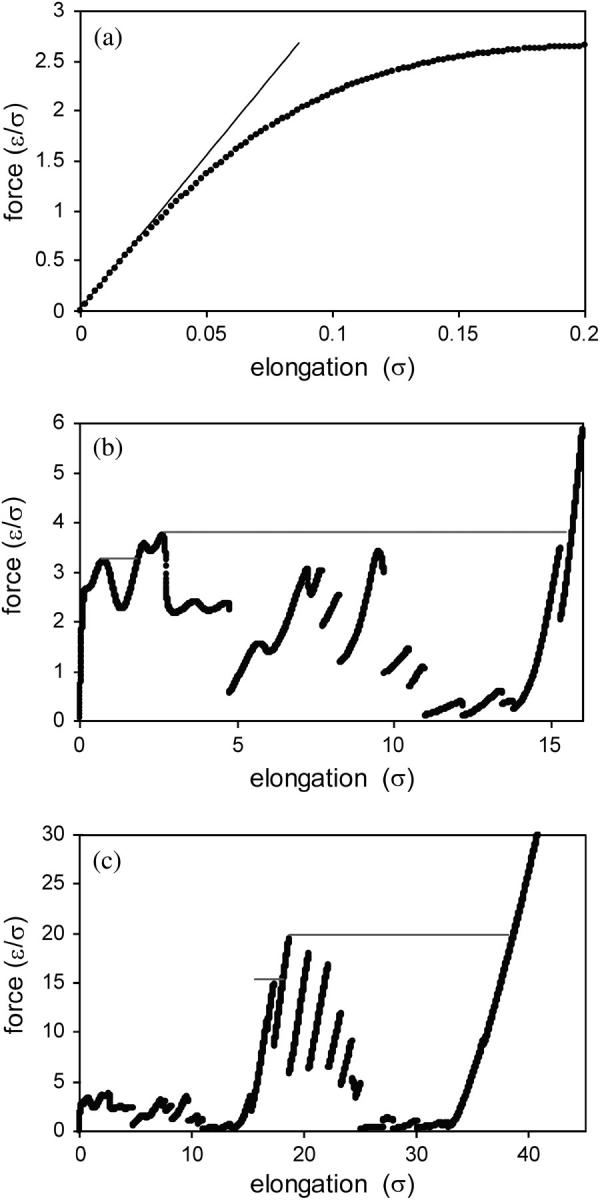
FIGURE 2.

Force as a function of elongation. The three plots show different ranges of elongation. The diagonal line in plot a is a guide to the quasi-elastic behavior, and the horizontal lines in plots b and c indicate structural transitions that the protein would undergo if the force, rather than elongation, is constrained and incremented.
