Abstract
Little is known about the direction and specificity of protein adsorption to solid surfaces, a knowledge that is of great importance in many biotechnological applications. To resolve the direction in which a protein with known structure and surface potentials binds to negatively charged silica nanoparticles, fluorescent probes were attached to different areas on the surface of the protein human carbonic anhydrase II. By this approach it was clearly demonstrated that the adsorption of the native protein is specific to limited regions at the surface of the N-terminal domain of the protein. Furthermore, the adsorption direction is strongly pH-dependent. At pH 6.3, a histidine-rich area around position 10 is the dominating adsorption region. At higher pH values, when the histidines in this area are deprotonated, the protein is also adsorbed by a region close to position 37, which contains several lysines and arginines. Clearly the adsorption is directed by positively charged areas on the protein surface toward the negatively charged silica surface at conditions when specific binding occurs.
INTRODUCTION
The fact that proteins readily adsorb to solid surfaces in a liquid/solid surface interface is a well-recognized phenomenon (Hlady and Buijs, 1996). This has implications in such diverse fields as biology, medicine, biotechnology, and food processing (Nakanishi et al., 2001). Often the adsorption is described as nuisance, but there are also examples of applications where adsorption is a desired behavior of a protein. Examples of such areas are biosensors, enzyme-linked immunoassays, adsorption chromatography, and protein delivery systems. However, for any rational design of such devices, knowledge of the adsorption direction is a prerequisite, since the adsorption direction influences, e.g., access to the active site (for enzymes) and recognition of epitopes by antibodies (for diagnostic purposes).
Much data on the adsorption direction comes from indirect methods such as ellipsometry, SPR, QCM, etc. Although none of these methods gives a direct measure of the orientation, the height and mass of the adsorbed protein layer in such experiments is often correlated to the orientation of adsorbed proteins. However, because of the very complex system involved, one always runs a risk of over- or misinterpretation of the data with respect to adsorption direction, as there are many forces and processes that can influence the height and mass of adsorbed protein. Examples of such processes are conformational changes of the adsorbed protein (Karlsson et al., 2000), exchange processes (Vermonden et al., 2001), lateral interactions (Moulin et al., 1999), reorientation (Wertz and Santore, 2002), and multilayer formation (Höök et al., 1998). Moreover, all these effects are interrelated, further complicating interpretation. Methods that more specifically monitor adsorption orientation have been presented in the literature (Lee and Saavedra, 1996; Cheng et al., 2003; Daly et al., 2003; Xu et al., 2003) and the results from these point to a nonrandom orientation of the adsorbed proteins. However, the resolution in the methods used so far is rather low, finding orientations and binding domains rather than specific regions where adsorption takes place. We have earlier used silica nanoparticles and site-directed fluorescently labeled protein for other protein interaction studies (Billsten et al., 1999; Karlsson et al., 2000; Hammarström et al., 2001; Carlsson et al., 2003). In this article we present the first application of silica nanoparticles and site-directed fluorescently labeled protein for the study of the direction of protein adsorption to solid surfaces. The advantages of applying this approach for the study of adsorption direction are manifold. First, the particles do not scatter light to any large extent, allowing spectrophotometric studies to be employed. Second, the nanoparticles have a very large effective surface area minimizing the risk of lateral interactions and therefore only the absolute adsorption direction rather than any effect from surrounding protein molecules will be registered. Third, by using site-directed fluorescent labeling we can probe and study the surface interaction at any position in the protein. By this approach we have in this work been able to show that the adsorption of human carbonic anhydrase II (HCA II) in the native state is specific and the binding surface has been mapped to a higher resolution than has previously been possible for any other protein.
MATERIALS AND METHODS
Chemicals
Guanidine-HCl (GuHCl) reagent grade, was obtained from Pierce (Rockford, IL) and was treated as described previously (Mårtensson et al., 1993), and the concentration was determined by refractive index (Nozaki, 1972). The chemical 7-Chloro-4-nitrobenzofurazan was obtained from Fluka (Stockholm, Sweden). The chemical 5-((((2-iodoacetyl)amino)-ethyl)amino)naphthalene-1-sulfonic acid (1,5-IAEDANS) was purchased from Molecular Probes (Leiden, The Netherlands). The colloidal, negatively charged silica particles (average diameter of 15 nm; pI ≈ 2) were kindly provided by EKA-Nobel (food-grade quality; EKA-Nobel, Stenungsund, Sweden). All other chemicals used were of the highest available grade.
Selection of mutation sites by computer evaluation and modeling
The coordinates for human carbonic anhydrase II (Håkansson et al., 1992) was extracted from the Protein DataBank (2CBA). Structural details were analyzed on a Silicon Graphics workstation (Silicon Graphics, Mountain View, CA) using the SYBYL 6.3 software (Tripos, St. Louis, MO). The surface with the electrostatic potentials at different pH values was generated by first adding all hydrogens to the crystal structure of the protein (neutral histidines) and then assigning all Kollman charges to the structure. To visualize the electrostatic potential at low pH values, all histidines in the structure were replaced with the protonated form of histidine and treated as above. For each of the protonation states the dipole moment vector was also calculated. The structures were saved as MOL2 files and imported into WebLab ViewerLite (WebLab, Molecular Simulations Inc., San Diego, CA). A surface of the electrostatic potential was generated of each form, after deletion of the ZnII atom.
Site-directed mutagenesis, protein expression, and purification
This work was done as previously described (Mårtensson et al., 2002). All mutations were made in a plasmid carrying the gene for a pseudo wild-type human carbonic anhydrase II (HCA IIpwt), containing the mutation C206S. By using this variant, which has the only cysteine in the wild-type protein replaced by a serine, it is possible to have a unique attachment site for the fluorescent probe in the engineered cysteine variants. HCA IIpwt has properties that are indistinguishable from those of the wild-type protein (Mårtensson et al., 1991, 1993).
Titration of free thiols
The content of free thiols was analyzed by labeling with 7-chloro-nitrobenzofurazan after denaturation for 5 min in 0.1 M Tris-H2SO4, pH 7.5 and 5 M GuHCl before adding a 10-fold molar excess of the reagent. Quantification was done spectrophotometrically using ɛ420nm = 13,000 M−1 cm−1 for the NBD-sulfur adduct (Birkett et al., 1971).
Labeling with fluorescent probes
Purified protein was first treated with a 100-fold molar excess of reduced dithiothreitol (DTTred) overnight to break any formed dimers. The protein was added to a few milliliters of benzenesulfonamide-agarose affinity gel, equilibrated with 10 mM Tris-H2SO4, pH 9.0, and washed with the same buffer until an absorbance of ≤0.010 to wash out any dimers and DTT. The gel was thereafter equilibrated with 50 mM Tris-H2SO4, pH 7.5 to lower the pH before reaction with the label. An ∼10-fold molar excess of 1,5-IAEDANS was allowed to run into the gel and react with the immobilized enzyme. The solution was left overnight to react, protected from light. After washing the gel from excess reagent with 10 mM Tris-H2SO4, pH 9.0, the protein was eluted and dialyzed as previously described (Mårtensson et al., 2002). The degree of labeling was determined by absorption measurements at 280 nm and 337 nm using the extinction coefficients 54,800 and 6100 M−1 cm−1, for the protein (Nyman and Lindskog, 1964) and the AEDANS probe (Jullien and Garel, 1981), respectively.
Enzyme activity measurements
The esterase activity was measured using p-nitrophenyl acetate as a substrate, according to Armstrong et al. (1966).
Stability measurements
The stability of the enzyme variants was determined from the red shift of the intrinsic Trp fluorescence maximum due to unfolding, after incubation of the enzyme (0.85 μM) overnight at 23°C, in various concentrations of GuHCl (0.1 M Tris-H2SO4, pH 7.5) as previously described (Karlsson et al., 2000).
Protein adsorption to 15-nm silica particles
Before use, the silica particles were dialyzed against 1 mM Tris-H2SO4, pH 8.0 to have a more well-defined particle solution (1.25 × 10⁻⁴ M). Stoichiometric amounts of particles and protein (0.85 μM) were used in all adsorption experiments. A 1-ml, 15-nm particle solution corresponds to an effective surface area of 3600 cm2. Human carbonic anhydrase II is classified as an ellipsoidal protein with the dimension 5.5 × 4.1 × 3.8 Å. In case of a side-on adsorption behavior of the protein, a surface of 93 cm2 would be required to allow all protein molecules to adsorb. Hence, by using nanoparticles, a surface that is at least 39 times larger than required is obtained, minimizing the probability of effects from lateral interactions among adsorbed protein molecules. The following buffers were used: 10 mM phosphate, pH 6.3 and 10 mM Tris-H2SO4 for pH 7.3, 8.3, or 9.3.
Gel permeation chromatography
A Bio-Rad BioLogic LP chromatography system (Bio-Rad, Hercules, CA) placed in a refrigerated cabinet (4°C) equipped with a Sephacryl S 200-HR gel (18 × 500 mm; Amersham Pharmacia Biotech, Uppsala, Sweden) was used. The chromatographies were, after a 5-min incubation with silica nanoparticles, run at pH 6.3 and pH 9.3. As references, free protein and particles alone were run on the same gel at pH 7.3. One milliliter of the samples (34 μM) was applied to the column with a flow rate of 1 ml/min.
Circular dichroism measurements
Circular dichroism (CD) spectra were recorded in the near-UV region (240–320 nm) on a CD6 Spectrodichrograph (Jobin-Yvon Instruments, Longjumeau, France) as previously described (Mårtensson et al., 2002). The protein (3.4 μM) in 10 mM buffer solutions in a 10-mm cuvette was analyzed with and without 15 nm particles (incubation time 20 min).
Fluorescence measurements
Fluorescence emission spectra were recorded at 4°C for the various AEDANS-labeled proteins (0.85 μM protein in 10-mM buffer solutions). Measurements were performed on a Fluoromax-2 (HORIBA Jobin-Yvon Instruments, Edison, NJ) with a thermostated cuvette holder. The AEDANS fluorophore was excited at 350 nm and the emission was registered between 450 and 550 nm with excitation and emission slits set to 3 and 4 nm, respectively. A spectrum of free protein was collected, based on two successive scans. The solution was thereafter supplemented with the silica nanoparticles (incubation time 5 min) and a spectrum of the adsorbed protein was recorded. Quenching studies were performed on the fluorescence of the AEDANS-labeled proteins with and without particles.
Anisotropy spectra of AEDANS-H10C
Anisotropy spectra on H10C-AEDANS (3.4 μM) were recorded at 4°C in 10 mM buffer solutions (see above) on a Hitachi F-4500 spectrofluorometer equipped with a thermostated cell (Hitachi, Tokyo, Japan). Excitation wavelength was 350 nm with excitation and emission slits set to 10 nm. The anisotropy of the AEDANS fluorophore was first determined for the free protein, and 15-nm silica particles were then added to the protein solution. After a 5-min incubation the anisotropy was determined for the adsorbed protein. The polarization of the exciting and emitted light was varied between vertical (v) and horizontal (h) to obtain all four combinations. The emitted fluorescence of AEDANS was collected in the wavelength range 450–550 nm. The fluorescence anisotropy (rs) was calculated using the formula
 |
where Ivv and Ivh are the intensities of the emission spectra with the respective polarization configuration and G is an apparatus constant (G = Ihv/Ihh) taking into account the polarization dependence of the detection system. No large differences in the G-factor were detected between solutions with or without 15-nm particles. G-factors between 1.25 and 1.30 were recorded with an average value of 1.27, which was used for calculation of all fluorescence anisotropy values.
Time-resolved fluorescence measurements of AEDANS-H10C
Fluorescence lifetimes of the AEDANS-H10C variant (0.85 μM) was measured at 4°C in 10-mM buffer solutions (see above) using a miniature lifetime analyzer, mini-τ (Edinburgh Instruments, Edinburgh, UK), equipped with a PDL 800-B pulsed diode laser (PicoQuant, Berlin, Germany). The measurements of the fluorescence lifetime of the AEDANS fluorophore were first performed on protein free in solution. Fifteen-nanometer particles were then added directly to the protein solution in the cuvette. After 5 min incubation the lifetime of the AEDANS fluorescence was determined for the adsorbed state. AEDANS was excited through a neutral density filter FNG-007 (OD = 0.3) with 380-nm excitation pulses (10-MHz repetition rate with ∼500-ps pulse width), whereas the emission was monitored through a FCG-057 longpass filter (>400 nm) (Melles Griot, Irvine, CA). Excitation and emission polarizers were both in the vertical position. The emitted photons were detected with a PC-based SPC-300 single photon counter with a 12-bit ADC (Edinburgh Instruments/PicoQuant) and were collected in 4096 channels. The measurement time was 5 min. The instrument response function was determined by measuring the light scatter for different buffers, with and without 15-nm particles. In this way an adjustment for the lifetime of the excitation could be made. Data were analyzed using the F900 analysis tool kit (Edinburgh Instruments). Instrument response function was subtracted from the experimental lifetime data. All data could be fitted to a two-exponential decay function using a tail-fit function. The average lifetime for each case was calculated using the formula for a lifetime average of a double-exponential decay,
 |
where α and τ are the amplitude and lifetime, respectively, for each phase. Knowing both the anisotropy (rs) and the average lifetime (τ) of the fluorophore makes it possible to calculate the rotational correlation time (φc) of the AEDANS fluorophore from the Perrin equation:
 |
RESULTS
Protein preparation and labeling
All protein cysteine mutants (Fig. 1 and Table 1) to be exploited for site-directed labeling were successfully expressed in Escherichia coli. However, there was, in some cases, a fraction of molecules that dimerized, because of the exposed cysteines. After reduction with Clelands reagent and separation from the reagent with PD-10 columns, SDS-PAGE showed that all protein variants were in a monomeric form, and NDB-Cl titration showed that more or less all the cysteines (>90%) were accessible in the native state. Initial attempts of labeling the protein with the fluorophore 1,5-IAEDANS resulted in some overlabeling, probably due to side reactions with reactive histidines in the active site. To overcome this problem, the enzyme variants were labeled while bound to affinity gel. All variants could be sufficiently labeled in the native state on the affinity gel, with the modification yield ranging between 60 and 100%.
FIGURE 1.
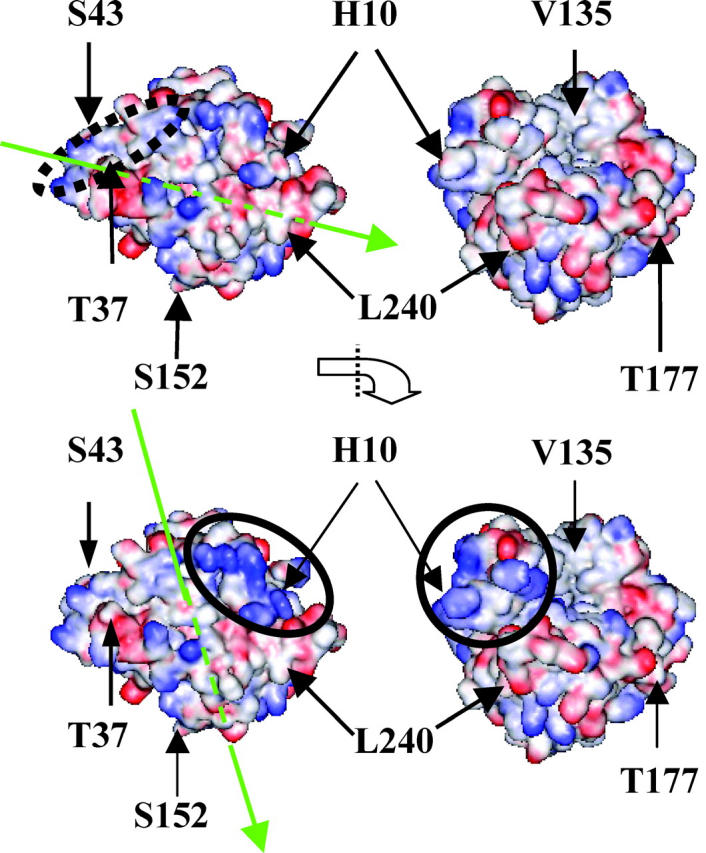
HCA II with the electrostatic potential at high pH with deprotonated histidines (top) and at low pH with protonated histidines (bottom) with the sites chosen for mutation and labeling indicated. The right picture is, in each case, the orthogonal projection of the left figure (∼90° anticlockwise rotation seen from the bottom). Note that position 43 is partly hidden. Red and blue colors correspond to negative and positive potential, respectively. The arrows in green in the left picture of each protonation state indicate the direction of the dipole vector. The arrowhead indicates the negative part of the dipole.
TABLE 1.
Properties of the mutation sites
| Position | Structural context | Fractional surface accessibility* | Number of H-bonds | Histidines and charged amino acids within a radius of 10 Å within the selected positions† |
|---|---|---|---|---|
| H10 | Turn | 1.05 | 1 | His3, His4, His15, His17 |
| ⊕ Lys9, Lys18 | ||||
| ⊖ Glu14 and Asp19 | ||||
| T37 | Turn | 0.74 | 1 | His36 |
| ⊕ Lys39, Lys252, Lys257, and Arg254 | ||||
| ⊖ Asp32, Asp34, Asp110 | ||||
| S43 | Turn | 0.77 | 1 | ⊕ Lys39, Lys45, Lys257, Lys261 |
| ⊖ Asp41, Asp85 | ||||
| V135 | Turn | 0.19 | 1 | ⊕ Lys127, Lys133, and Arg27 |
| ⊖ Asp139 and Glu205 | ||||
| S152 | Random coil | 0.94 | 0 | ⊕ Lys149, Lys154 |
| ⊖ Glu221 | ||||
| T177 | End of β-sheet | 1.35 | 1 | ⊕ Lys159 and Arg58 |
| ⊖ Asp71, Asp175, Asp180, and Glu69 | ||||
| L240 | Loop | 0.58 | 1 | ⊕ Lys168, Lys170, Lys225, Lys228, and Arg227 |
| ⊖ Glu236, Glu238, Glu239, and Asp243 |
Fractional accessibility was determined for the wild-type amino acid as the ratio of the absolute area of each amino acid divided by the area of the same, exposed amino acid situated in a tripeptide, Ala-Xaa-Ala (Lee and Richards, 1971).
In addition to these charged amino acids there are charged amino acids in the region between positions 10 and 37 (Lys24, Glu26, Arg27, and Arg254).
We have previously shown that HCA II strongly binds to silica nanoparticles and that the stability of HCA II determines to what extent the protein is denatured as a consequence of the surface-adsorption process (Karlsson et al., 2000). For that reason the stability of the mutated and mutated/labeled proteins were determined. When the stability of the native conformation of the mutants are compared with that of HCA IIpwt, it was found that the introduced cysteines do not affect the stability to any large extent. The midpoints of unfolding after incubation in guanidine hydrochloride of the mutants were in the range 0.8–1.0 M, which is comparable to the corresponding value of HCA IIpwt (1.0 M). It is also noteworthy that the attachment of the rather large AEDANS fluorescent probe on the surface of the protein variants does not decrease the stability beyond that caused by the mutation. Moreover, mutation and labeling do not seem to affect the function of the enzyme, as all mutants in the labeled state had activities close to 100% compared to that of HCA IIpwt.
Conformational status of the adsorbed protein variants
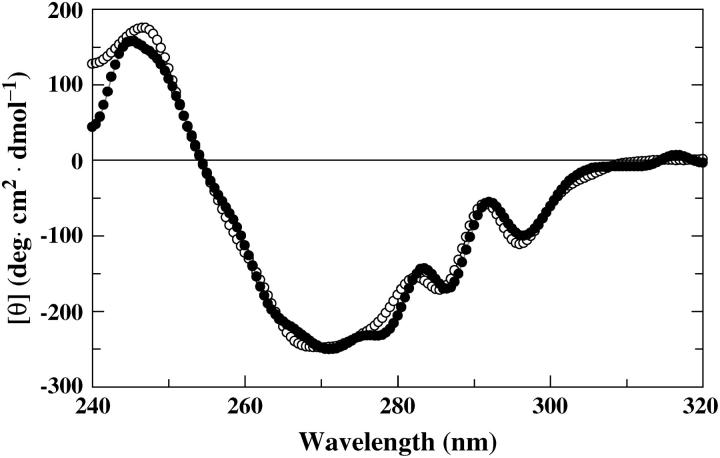
Since there is a possibility that the fluorescent probe will report also on the conformational state of the protein, in addition to the interaction with the solid surface, surface-induced unfolding of the protein variants would interfere with the data interpretation. Therefore, the structural effects of the adsorption to the surface were analyzed by near-UV circular dichroism (CD) spectroscopy. CD spectra of labeled protein variants were recorded in the free state and after incubation with nanoparticles for 20 min at 23°C. A significant conformational change occurred for all variants at this temperature since the amplitude of the CD band at 270 nm, reflecting the status of the tertiary structure, decreased with 3–19% depending on protein variant. However, when the same experiments were performed at 4°C, the spectra of free and adsorbed protein coincided, indicating that the native tertiary structure is intact upon adsorption to the silica particles at 4°C (Fig. 2). Thus, by lowering the temperature to 4°C, it is possible to prevent denaturation of all the protein variants in the time-span monitored. Because of these results all the following measurements were performed at 4°C.
FIGURE 2.
Near-UV CD spectra of AEDANS-H10C in the free state (○) and after a 20-min incubation with silica nanoparticles (•). The ellipticity, [θ], is reported as the mean residue molar ellipticity.
The adsorption directions reported by the fluorescent probes
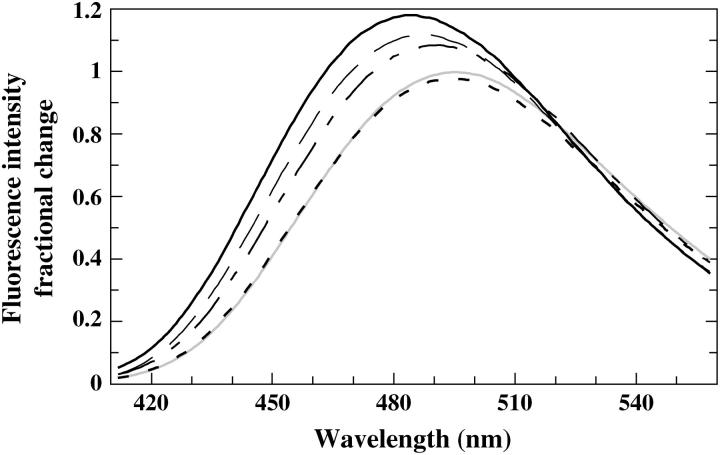
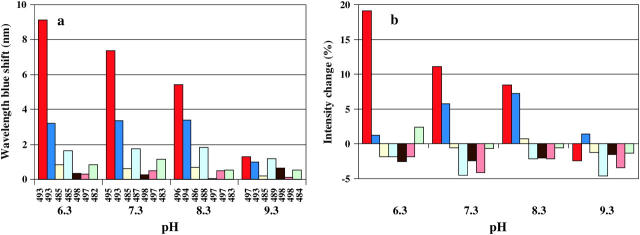
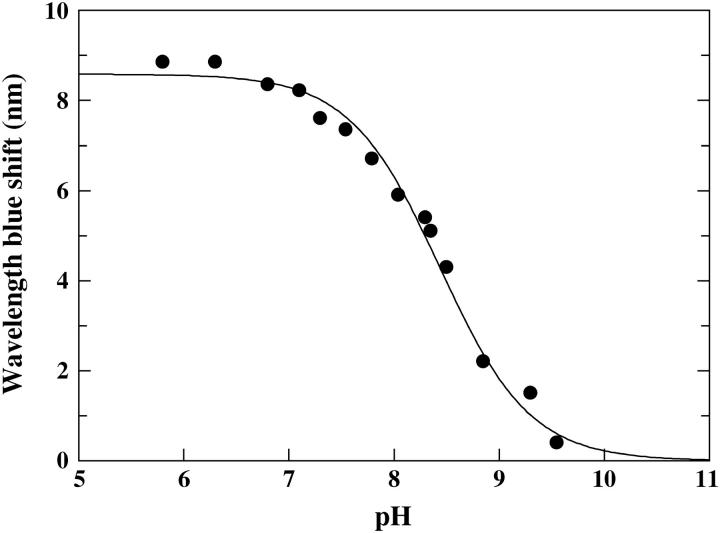
The only AEDANS-labeled positions that give rise to significant spectral responses upon binding to the nanoparticles are positions 10 and 37 (Figs. 3 and 4). Furthermore, the different pH-dependence of the fluorescence from the AEDANS-probe in these positions shows that the adsorption preferences within this area are shifting with pH. At pH 9.3 the fluorescent probe in all positions report only minor spectral changes upon adsorption and the evenly distributed small blue shifts of the fluorescence from all of the probes indicate that the adsorption at high pH (9.3) is largely unspecific. Fig. 5 shows a detailed pH titration curve of the fluorescence wavelength shift of AEDANS-H10C, emphasizing the strong pH-dependence of the binding around position 10 with a midpoint at pH 8.4. It should be pointed out that the observed fluorescence changes are most unlikely due to lateral protein-protein interactions. This is based on the fact that the silica nanoparticles provide a large excess of effective surface area compared to the area needed for adsorption of all protein molecules (see Materials and Methods). Furthermore, to definitely rule out any protein-protein effects, an additional experiment was performed where only one-quarter of the silica nanoparticle concentration was used. This will have the effect to lower the available area and thereby increase the probability for any protein-protein interaction to occur, which would show up as a changed fluorescence at interacting positions. The experiment was performed at the pI of the protein (pH 7.3) to minimize repulsion between protein molecules. For this control study we used fluorescently AEDANS-labeled H10C, V135C, S152C, and T177C variants, and this resulted in spectral changes that within experimental error were identical to those obtained when mixing stoichiometric amounts of protein and silica nanoparticles (data not shown), which strongly supports the notion that the fluorescent labels probe protein-surface interactions and not protein-protein interactions.
FIGURE 3.
Spectral changes of the fluorophore in position 10 upon adsorption to silica nanoparticles at pH 6.3 ( ), pH 7.3 (— — —), pH 8.3 (— – —), pH 9.3 (- - -), and an average spectra of labeled H10C in the free state at pH 6.3–9.3 (
 ). Spectra were registered after 5 min incubation with silica nanoparticles and where identical to spectra registered at 1 and 2.5 min, i.e., no additional process besides the adsorption took place during this time-span.
FIGURE 4.
(a) Fluorescence wavelength shifts of the AEDANS probe in different positions of the protein upon adsorption. The labeled variants were incubated for 5 min with silica nanoparticles at different pH values before recording of the spectra. The number below each bar represents the emission wavelength maximum of the fluorescent probe in the free, non-adsorbed protein. (b) Fluorescence intensity change of the AEDANS probe in different positions of the protein upon adsorption. Colors in both figures (from left to right) are: AEDANS-H10C (red), T37C (dark blue), S43C (yellow), V135C (light blue), S152C (brown), T177C (orange), and L240C (green).
FIGURE 5.
Wavelength blue shift of AEDANS-H10C upon adsorption as a function of pH. The following buffers were used: 10 mM phosphate buffer in the range pH 5.8–7.1 and 10 mM Tris-H2SO4 in the pH range 7.3–9.5.
Adsorption capacity at high and low pH
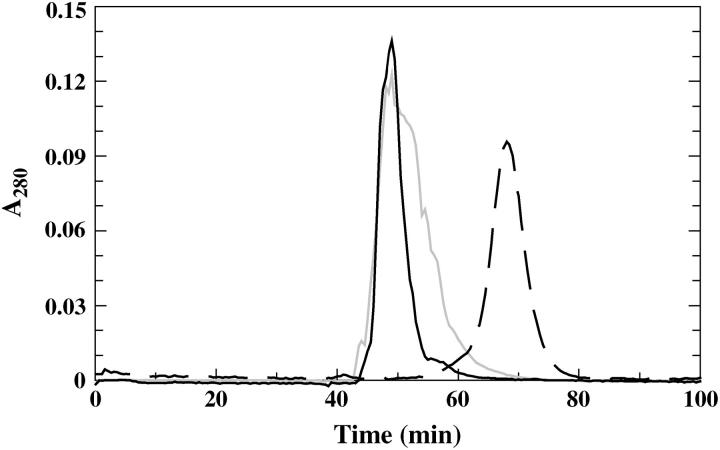
Since the spectral effects were markedly decreased for AEDANS-H10C when pH was raised and were, similar to all other labeled variants, very small at pH 9.3, it was important to investigate whether the protein is still bound to the silica nanoparticles at high pH. Therefore, gel permeation chromatography of labeled protein in the free state and adsorbed to silica nanoparticles was conducted. As is clear from Fig. 6 the analyzed protein (AEDANS-V135C) was adsorbed also at pH 9.3, as the peak elutes earlier than the free protein and with the same retention time as for the free particles and for the same protein variant run with particles at pH 6.3. However, the protein elutes with a broader tailing of the peak at pH 9.3, compared to that at pH 6.3.
FIGURE 6.
Gel permeation chromatography profiles of labeled protein with and without free silica nanoparticles. Free AEDANS-V135C was chromatographed at pH 7.3 (— — —) and AEDANS-V135C incubated with silica nanoparticles at pH 6.3 ( ), and pH 9.3 (
 ). The signal due to scattering from particles (free silica particles run at pH 7.3) is subtracted from the signal of the adsorbed proteins.
Conformational status of adsorbed AEDANS-H10C at different pH values
The large effect that the pH had on the fluorescence signal upon adsorption in position 10 also prompted complementing near-UV CD measurements of particle-bound AEDANS-H10C in the pH range 6.3–9.3 at 4°C. No spectral changes could be observed (data not shown) showing that the tertiary structure of the protein was unaffected by the adsorption in this pH interval. Thus, the noted large pH effects on fluorescence are due to the shift in adsorption direction of the protein rather than a pH-dependent conformational change.
Accessibility of the probes in the free and adsorbed state of the protein
By quenching studies of the AEDANS fluorescence intensity on the free protein in solution and when adsorbed to silica nanoparticles, complementary information about the adsorption behavior can be obtained. Acrylamide was used as a quencher at various pH values on three representative AEDANS-labeled variants and the data are presented as Stern-Volmer plots (Fig. 7, a–c). The Stern-Volmer plot of the AEDANS-H10C variant (Fig. 7 a) displays a behavior that correlates well with the noted large wavelength shift and intensity change in Fig. 4, a and b. At low pH (6.3 and 7.3) the fluorescent probe is protected form the surrounding media, as reported by the low quenching by acrylamide. As the pH increases, the fluorescent probe becomes more accessible to quenching by acrylamide until finally at pH 9.3 it is as accessible as the probe in the free protein. Note also that the midpoint of accessibility that can be estimated from the quenching data corresponds rather well with that obtained from the change in fluorescence wavelength shift (pH 8.4, Fig. 5). The AEDANS-T37C variant (Fig. 7 b) also displays a quenching behavior that corresponds to its wavelength shift behavior upon adsorption (Fig. 4, a and b). The probe in this position is protected to the same degree from the environment in the pH interval 6.3–8.3, in agreement with the constant wavelength shift of the fluorescence, from the probe in this position at the same pH values. At pH 9.3 the probe becomes more accessible to quenching by acrylamide, which is also in line with the corresponding wavelength shift data. However, even at pH 9.3 the probe does not become as exposed as in the free protein, suggesting that the protein has some preferential binding in the vicinity of position 37 at elevated pH values. AEDANS-S152C was chosen to represent the variants that did not show any large changes in wavelength shift or intensity upon adsorption (Fig. 7 c). Correspondingly, the probe is only marginally protected from the environment when bound to silica particles throughout the entire pH range tested, as compared to the same variant free in solution.
FIGURE 7.
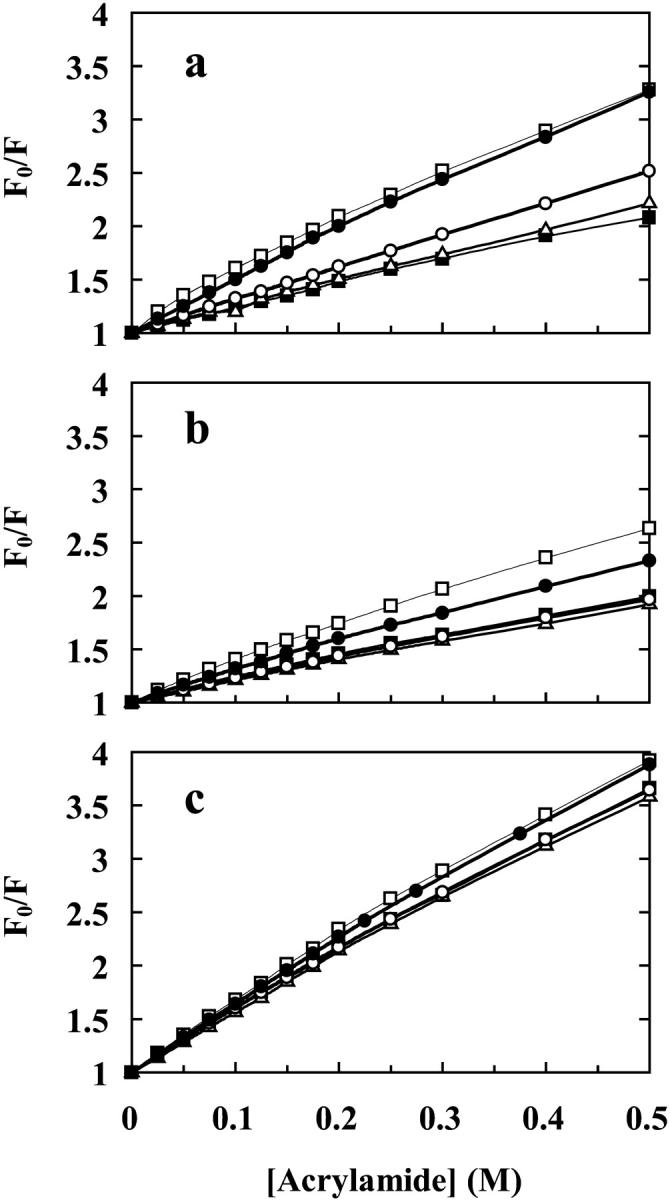
Stern-Volmer plots of acrylamide quenching of the fluorescence of labeled protein variants with and without particles. (a) AEDANS-H10C, (b) AEDANS-T37C, and (c) AEDANS-S152C. The protein free in solution (□) and after 5 min incubation with silica nanoparticles at pH 6.3 (▪), 7.3 (Δ), 8.3 (○), and 9.3 (•).
Changes in the rotational correlation time of the fluorescent probe in position 10
The lifetime and anisotropy of the AEDANS fluorophore in position 10 in the free state in solution and in the adsorbed state after a 5-min incubation were determined at different pH values, from which data the rotational correlation times of the fluorophore were calculated for different pH values. The rotational correlation time reports on the rotational freedom of the fluorophore. The rotational correlation time of the AEDANS fluorophore in the free protein at pH 6.3–9.3 had an average value of 5.4 ns (Table 2). This is a rather fast rotation, especially considering the low temperature, indicating that the fluorophore is free to rotate independently of the protein, which has been found to have a rotational correlation time of 11.2 ns at 25°C (Yguerabide et al., 1970). The fast rotational correlation time is thus in agreement with the expected surface location of the AEDANS fluorophore. However, upon adsorption to silica nanoparticles at pH 8.3 and below, both the anisotropy and average lifetimes of the probe are dramatically increased. As before, there is a clear pH dependence in that lower pH values give rise to more pronounced effects. The associated average rotational correlation times were found to increase with decreasing pH.
TABLE 2.
Results of fluorescence anisotropy and lifetime measurements in position 10
| Free protein
|
Adsorbed to 15 nmp
|
|||||
|---|---|---|---|---|---|---|
| pH | rs | τs (ns)* | φc (ns) | rs | τs (ns)* | φc (ns) |
| 6.3 | 0.14 | 11.7 | 6.4 | 0.25 | 16.9 | 27.5 |
| 7.3 | 0.12 | 12.8 | 5.2 | 0.24 | 16.8 | 24.4 |
| 8.3 | 0.13 | 11.4 | 5.4 | 0.21 | 15.2 | 17.1 |
| 9.3 | 0.11 | 11.4 | 4.6 | 0.14 | 12.2 | 6.6 |
The lifetime is the average of a double-exponential decay (see Materials and Methods).
DISCUSSION
Based on information from the localization of charges, structural data from the ProTable module in SYBYL and visual inspection of the protein structure, the positions marked in Fig. 1 and listed in Table 1 were selected to be mutated. Cysteines were engineered one at a time in each mutant to be used as handles to which a fluorescent probe was attached. Sites for mutation were chosen from the following criteria:
The site should be located on the surface with the amino-acid side chain extending into the solution with a high fractional surface-accessible area so as to enable labeling in the native state.
The amino acid to be substituted should have a low number of intramolecular hydrogen bonds, this to only marginally affect the stability of the mutated protein.
The sites should be in, or close to, electrostatically interesting areas.
The sites should be evenly distributed over the protein surface (Fig. 1 and Table 1).
Stability, activity, and labeling results suggested that all the selected positions and produced protein variants could be used for studies of the adsorption to silica nanoparticles. Studies of the circular dichroism in the near-UV region upon adsorption to silica nanoparticles at different temperatures and pH, verified that the structure remained intact during adsorption experiments at 4°C (Fig. 2). Furthermore, the gel permeation chromatography of protein mixed with nanoparticles at different pH values verified that the protein does also adsorb at pH 9.3. However, at pH 6.3 the protein elutes with a narrower peak, indicating that the protein is more strongly adsorbed at this pH, i.e., the equilibrium between free and adsorbed protein is shifted toward the adsorbed state (Fig. 6).
The fluorescence wavelength shift and intensity data (Fig. 4, a and b), as well as the quenching results (Fig. 7, a–c), together strongly point to a pH-dependent specific adsorption of the protein in the regions surrounding positions 10 and 37 in the N-terminal domain of the protein structure (Fig. 1). From the pH-dependence of the fluorescence of AEDANS-H10C (Fig. 5) it is clear that the directionality of the adsorption around position 10 is more pronounced at lower pH values under these conditions, as there is both a larger blue shift and a higher intensity increase (Fig. 4 b) upon adsorption at low pH. The sigmoidal curve in Fig. 5 most likely reflects the local charge distribution on the surface that directs the adsorption of this region. The preferred binding in the vicinity of position 10 at lower pH should be due to the presence of several His residues that are positioned close to the inserted probe (Fig. 1 and Table 1). As the pH is lowered, these His residues become protonated and positively charged, and can thereby guide the adsorption to the negatively charged silica nanoparticles. This is also supported by the quenching results of AEDANS-H10C, which demonstrate that the fluorescent probe is more protected from the quencher at low pH values. The above interpretation of data is further verified by the pH-dependence of the rotational correlation times of the fluorescent probe in position H10C (Table 2). This result clearly demonstrates that the fluorophore goes from rotating fairly independently of the protein in the non-adsorbed state to become locked in between the protein and the silica nanoparticle upon adsorption. This is reflected in rotational correlation times that are slower for the larger protein/silica particle complex than for a fluorophore locked in the protein structure only, when adsorbed at lower pH values. For position 37 there is, on the other hand, a constant fluorescence blue shift upon adsorption to the nanoparticles in the pH range 6.3–8.3 which, as for all the other AEDANS-labeled variants, drops off at pH 9.3 (Fig. 4 a). In this case, the fluorescence data is also supported by the quenching experiment (Fig. 7 b). Interestingly, the fluorescence intensity of the fluorophore upon adsorption in this position increases with increasing pH in the pH range 6.3–8.3, contrary to what is observed for AEDANS-H10C (Fig. 4 b). Thus, it appears as though the specificity of binding is shifted to the region around position 37 at higher pH values. This can be explained by the fact that position 37 is located in a positive region with residues of higher pKa values than in the region around position 10 (Table 1). Thus, the electrostatic attraction from the latter region is decreasing when more and more His residues here become deprotonated. At pH 8.3 the fluorescence intensity and blue shift is of similar magnitude for the AEDANS-probe in positions 10 and 37, indicating that the corresponding regions are bound equally well, i.e., that the protein adsorbs with mixed directions at this pH (Fig. 4, a and b). Interestingly, this correlates well with the calculated dipole vector at the respective pH (Fig. 1). At high pH the positive end of the dipole vector passes through position T37C, indicating that the dipole moment might also contribute to the adsorption orientation at elevated pH values. At low pH values the vector of the dipole moment is shifted in a way that makes the positive end of the vector move closer to the region of H10C, although it does not pass through position 10. This indicates that the local high concentration of positive charges in the region surrounding position 10 is the principal determinant of protein adsorption orientation, although the dipole moment of the protein might also contribute to the orientation of the protein.
At pH 9.3, when there are no regions on the protein surface that are predominantly positively charged (Fig. 1), no strong preference for specific adsorption is observed. Moreover, the protein is at this pH carrying a total negative charge, since the pI of HCA II is 7.3 (Jonsson and Pettersson, 1968).
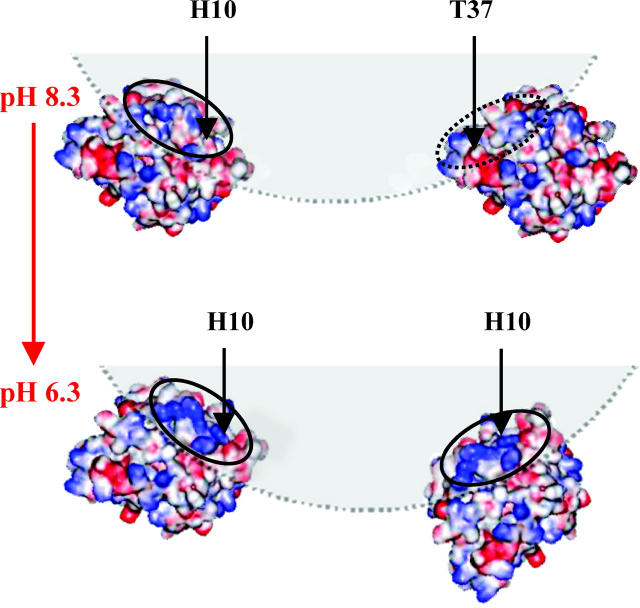
The locations of the areas giving rise to specific adsorption suggest that at pH 6.3 there is an approximate side-on adsorption, whereas at pH 8.3 there are mixed side-on and end-on adsorptions through the regions around positions 10 and 37, respectively. This is schematically illustrated in Fig. 8.
FIGURE 8.
Model of the adsorption direction of HCA II to the silica nanoparticles. The adsorption is illustrated at pH 8.3 and 6.3 with the interacting surfaces encircled. The drawings are made in an approximate 1:1 scalar relationship between the 15-nm silica particles (in shading) and the protein.
We have in this article described that it is possible to employ site-directed fluorescent labeling in combination with nanoparticles to elucidate the adsorption direction to solid surfaces by spectroscopic methods. In our opinion the described methodology is a powerful tool for specific mapping of the interaction area between adsorbed protein and a solid surface.
Acknowledgments
This work was financially supported by the Swedish Research Council (to U.C.) and Stiftelsen Lars Hiertas Minne (to M.K.).
Abbreviations used: AEDANS-H10C, histidine 10 in HCA IIpwt replaced with cysteine and labeled with 1,5-IAEDANS; HCA II, human carbonic anhydrase II; HCA IIpwt, pseudo wild-type human carbonic anhydrase II, with a Cys206→Ser mutation; 1,5-IAEDANS, 5-((((2-iodoacetyl)amino)-ethyl)amino)naphthalene-1-sulfonic acid.
References
- Armstrong, J. M., D. V. Meyrs, J. A. Verpoorte, and J. T. Edsall. 1966. Purification and properties of human erythrocyte carbonic anhydrases. J. Biol. Chem. 241:5137–5149. [PubMed] [Google Scholar]
- Billsten, P., U. Carlsson, B.-H. Jonsson, G. Olofsson, F. Höök, and H. Elwing. 1999. Conformation of human carbonic anhydrase II variants adsorbed to silica nanoparticles. Langmuir. 15:6395–6399. [Google Scholar]
- Birkett, D. J., R. A. Dwek, G. K. Radda, R. E. Richards, and A. G. Salmon. 1971. Probes for the conformational transitions of phosphorylase b. Effect of ligands studied by proton relaxation enhancement, fluorescence and chemical reactivities. Eur. J. Biochem. 20:494–508. [DOI] [PubMed] [Google Scholar]
- Carlsson, K., P.-O. Freskgård, E. Persson, U. Carlsson, and M. Svensson. 2003. Probing the interface between factor Xa and tissue factor in the quaternary complex tissue factor/factor VIIa/factor Xa/tissue factor pathway inhibitor. Eur. J. Biochem. 270:2576–2582. [DOI] [PubMed] [Google Scholar]
- Cheng, Y.-Y., S. H. Lin, H.-C. Chang, and M.-C. Su. 2003. Probing adsorption, orientation and conformational changes of cytochrome c on fused silica surfaces with the Soret band. J. Phys. Chem. A. 107:10687–10694. [Google Scholar]
- Daly, S. M., T. M. Przybycien, and R. D. Tilton. 2003. Coverage-dependent orientation of lysozyme adsorbed on silica. Langmuir. 19:3848–3857. [Google Scholar]
- Hammarström, P., R. Owenius, L.-G. Mårtensson, U. Carlsson, and M. Lindgren. 2001. High resolution probing of local conformational changes in proteins by the use of multiple labeling: unfolding and aggregation of human carbonic anhydrase II monitored by spin, fluorescent and chemical reactivity probes. Biophys. J. 80:2867–2885. [DOI] [PMC free article] [PubMed] [Google Scholar]
- Hlady, V., and J. Buijs. 1996. Protein adsorption on solid surfaces. Curr. Opin. Struct. Biol. 7:72–77. [DOI] [PMC free article] [PubMed] [Google Scholar]
- Håkansson, K., M. Carlsson, L. A. Svensson, and A. Liljas. 1992. Structure of native and apo-carbonic anhydrase II and structure of some of its anion-ligand complexes. J. Mol. Biol. 227:1192–1204. [DOI] [PubMed] [Google Scholar]
- Höök, F., M. Rodahl, B. Kasemo, and P. Brzezinksi. 1998. Structural changes in hemoglobin during adsorption to solid surfaces: effects of pH, ionic strength, and ligand binding. Proc. Natl. Acad. Sci. USA. 95:12271–12276. [DOI] [PMC free article] [PubMed] [Google Scholar]
- Jonsson, M., and E. Pettersson. 1968. Isoelectric fractionation, analysis, and characterization of ampholytes in natural pH gradients. VI. Isoelectric spectrum of bovine carbonic anhydrase B. Acta Chem. Scand. 22:712–713. [DOI] [PubMed] [Google Scholar]
- Jullien, M., and J.-R. Garel. 1981. Fluorescent probe of ribonuclease A conformation. Biochemistry. 20:7021–7026. [DOI] [PubMed] [Google Scholar]
- Karlsson, M., L.-G. Mårtensson, B.-H. Jonsson, and U. Carlsson. 2000. Adsorption of human carbonic anhydrase II variants to silica nanoparticles occur stepwise: binding is followed by successive conformational changes to a molten-globule-like state. Langmuir. 16:8470–8479. [Google Scholar]
- Lee, B., and F. M. Richards. 1971. The interpretation of protein structures: estimation of static accessibility. J. Mol. Biol. 55:379–400. [DOI] [PubMed] [Google Scholar]
- Lee, J. E., and S. S. Saavedra. 1996. Molecular orientation in heme protein films adsorbed to hydrophilic and hydrophobic glass surfaces. Langmuir. 12:4025–4032. [Google Scholar]
- Moulin, A. M., S. J. O'Shea, R. A. Badley, P. Doyle, and M. E. Welland. 1999. Measuring surface-induced conformational changes in protein. Langmuir. 15:8776–8779. [Google Scholar]
- Mårtensson, L.-G., B.-H. Jonsson, M. Andersson, A. Kihlgren, N. Bergenhem, and U. Carlsson. 1991. Role of an evolutionarily invariant serine for the stability of human carbonic anhydrase II. Biochim. Biophys. Acta. 1118:179–186. [DOI] [PubMed] [Google Scholar]
- Mårtensson, L.-G., B.-H. Jonsson, P.-O. Freskgård, A. Kihlgren, M. Svensson, and U. Carlsson. 1993. Characterization of folding intermediates of human carbonic anhydrase II. Probing substructure by chemical labeling of SH-groups introduced by site-directed mutagenesis. Biochemistry. 32:224–231. [DOI] [PubMed] [Google Scholar]
- Mårtensson, L.-G., M. Karlsson, and U. Carlsson. 2002. Dramatic stabilization of the native state of human carbonic anhydrase II by an engineered disulfide bond. Biochemistry. 41:15867–15875. [DOI] [PubMed] [Google Scholar]
- Nakanishi, K., T. Sakiyama, and K. Imamura. 2001. On the adsorption of proteins on solid surfaces, a common but very complicated phenomenon. J. Biosci. Bioeng. 91:233–244. [DOI] [PubMed] [Google Scholar]
- Nozaki, Y. 1972. The preparation of guanidine hydrochloride. Methods Enzymol. 26:43–50. [DOI] [PubMed] [Google Scholar]
- Nyman, P. O., and S. Lindskog. 1964. Amino acid composition of various forms of bovine and human erythrocyte carbonic anhydrase. Biochim. Biophys. Acta. 85:141–151. [DOI] [PubMed] [Google Scholar]
- Vermonden, T., C. E. Giacomelli, and W. Norde. 2001. Reversibility of structural rearrangements in bovine serum albumin during homomolecular exchange from AgI particles. Langmuir. 17:3734–3740. [Google Scholar]
- Wertz, C. F., and M. M. Santore. 2002. Adsorption and reorientation kinetics of lysozyme on hydrophobic surfaces. Langmuir. 18:1190–1199. [Google Scholar]
- Xu, W., H. Zhou, and F. E. Regnier. 2003. Regio-specific adsorption of cytochrome c on negatively charged surfaces. Anal. Chem. 75:1931–1940. [DOI] [PubMed] [Google Scholar]
- Yguerabide, J., H. F. Epstein, and L. Stryer. 1970. Segmental flexibility in an antibody molecule. J. Mol. Biol. 51:573–590. [DOI] [PubMed] [Google Scholar]


