
FIGURE 1.
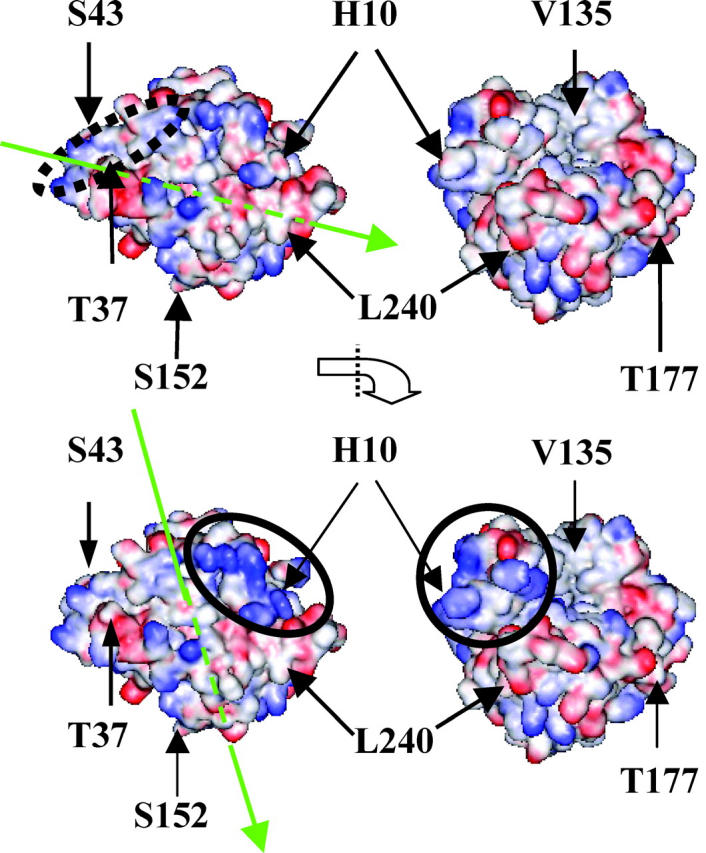
HCA II with the electrostatic potential at high pH with deprotonated histidines (top) and at low pH with protonated histidines (bottom) with the sites chosen for mutation and labeling indicated. The right picture is, in each case, the orthogonal projection of the left figure (∼90° anticlockwise rotation seen from the bottom). Note that position 43 is partly hidden. Red and blue colors correspond to negative and positive potential, respectively. The arrows in green in the left picture of each protonation state indicate the direction of the dipole vector. The arrowhead indicates the negative part of the dipole.