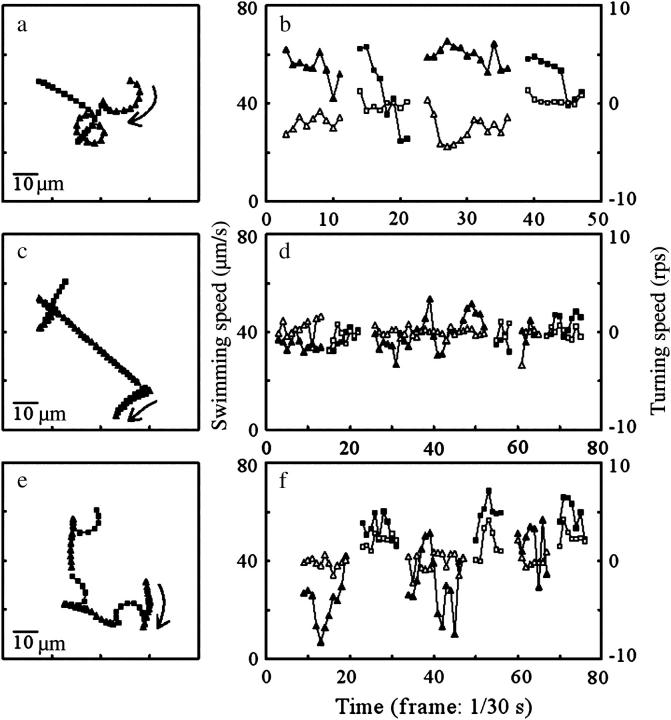
FIGURE 7.
Typical examples of bacterial motion close to and far from walls. The motions were recorded near the upper surface (a and b), at the middle position (c and d), and near the lower surface (e and f). Trajectories are indicated in a, c, and e. The swimming speeds (closed symbols) and turning speeds (open symbols) calculated from a, c, and e are provided in b, d, and f. Triangles and squares refer to the data points included in the odd- and even-numbered subtrajectories. Arrows in a, c, and e indicate the first subtrajectories and their directions of progress. The data points at turns are not represented.

