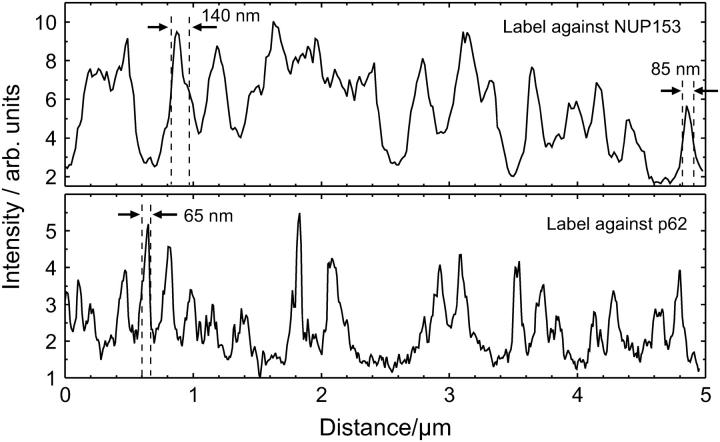
FIGURE 6.
Comparison of cross sections through several fluorescence spots in Fig. 4 b (p62-labeled NE) and Fig. 5 h (NUP153-labeled NE) (location of section is indicated by a dotted line in both figures). The spot size (FWHM) of p62-tagged NPCs is ∼60 nm, whereas the spot size of NUP153-tagged NPCs varies between 80 nm and 140 nm. The different size of the fluorescence spots is likely due to the different distributions of epitopes of the targeted proteins within the NPC (cf. Fig. 7).

