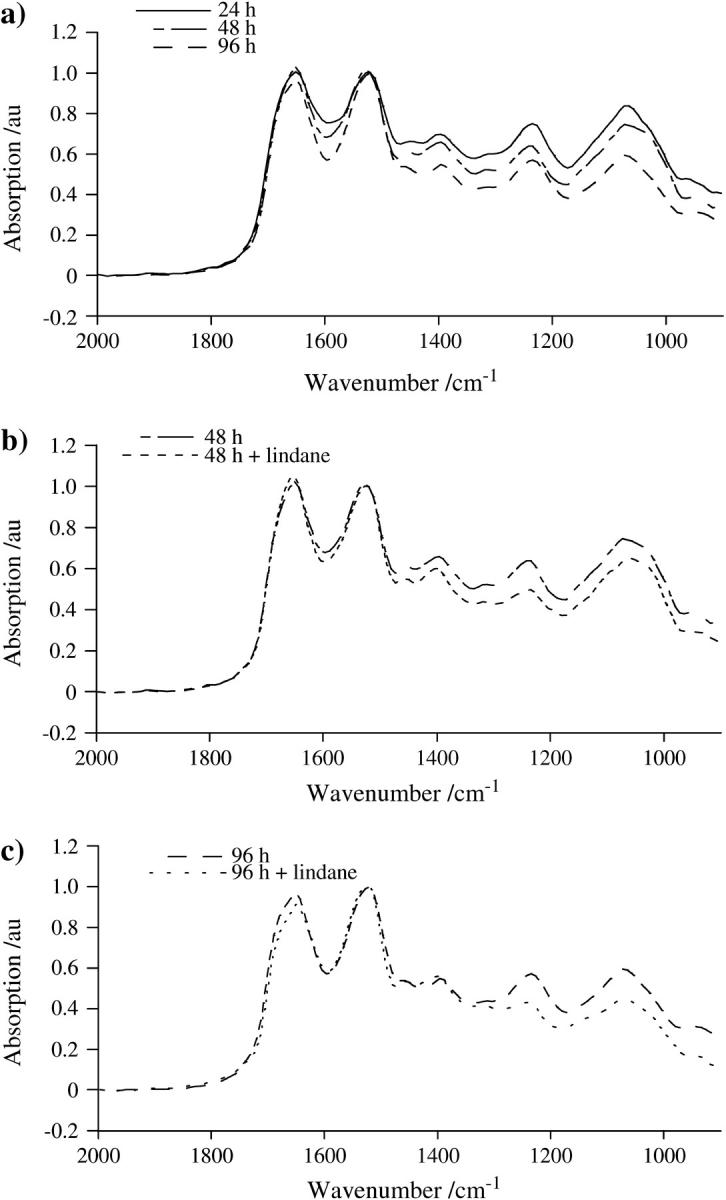
FIGURE 2.

(a) Median IR spectra (2000–900 cm−1) of a maximum of 10 recorded per cell culture sample over a time course of 24 h, 48 h, and 96 h, as indicated. Cells were seeded into 60-mm petri dishes containing glass coverslips and fixed before analysis, as described in the Materials and Methods. (b) Median IR spectra after 48-h incubation in the absence or presence of 24-h treatment with 10−4 M lindane. Cells were treated after an initial 24-h incubation in lindane-free medium; whereupon they were immediately fixed before analysis. (c) Median IR spectra after 96-h incubation in the absence or presence of 24-h treatment with 10−4 M lindane. After an initial 24-h incubation in lindane-free medium, cells were treated with the agent for 24 h after which they were incubated in fresh medium for a further 48 h. At the end of this 96-h incubation, they were immediately fixed before analysis.
