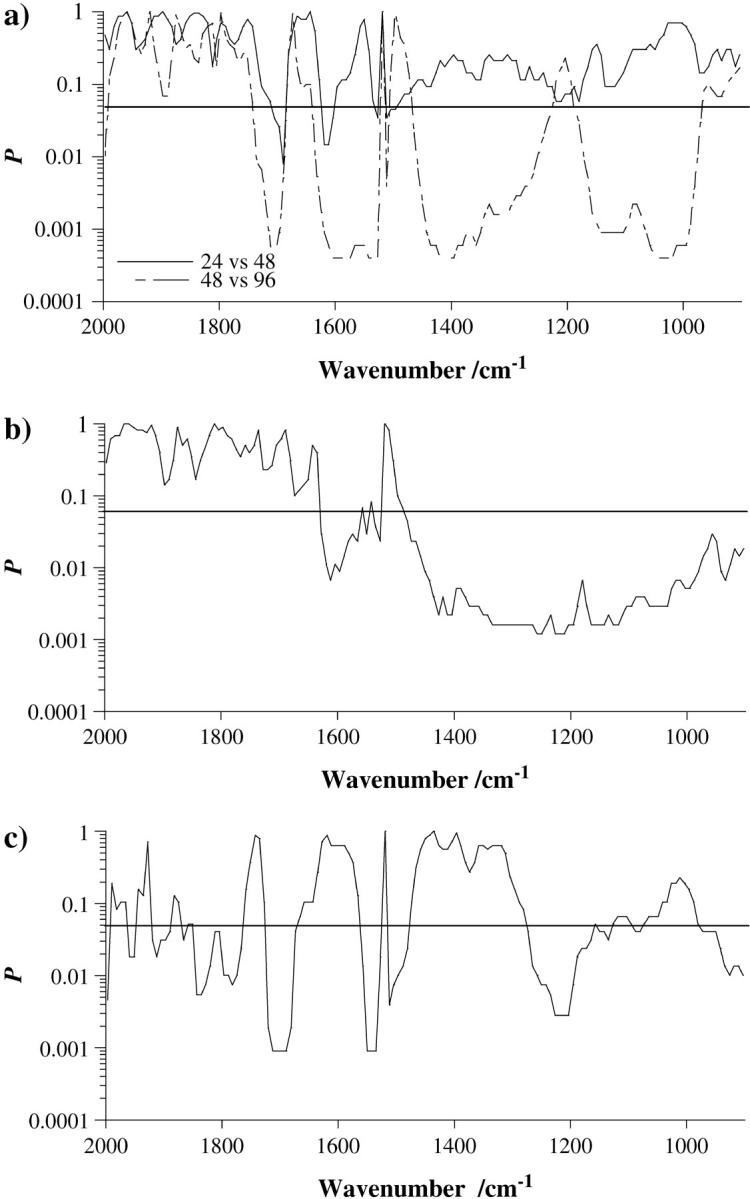
FIGURE 4.

(a) Plot depicting the statistical significance, as calculated by the Mann-Whitney U test, of differences at each wavenumber in the spectra for 24 h vs. 48 h and 48 h vs. 96 h incubation time, as indicated. (b) Plot depicting the statistical significance in the spectra for 48 h vs. 48 h plus lindane. (c) Plot depicting the statistical significance in the spectra for 96 h vs. 96 h plus lindane. A P < 0.05 was selected as indicating significance.
