Figure 1.
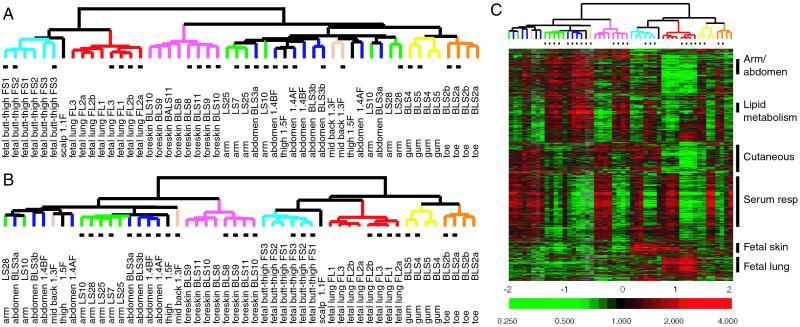
Topographic differentiation of fibroblasts. (A) Unsupervised hierarchical clustering of cultured fibroblasts. The global gene expression patterns of 50 fibroblast cultures were sorted based on similarity by hierarchical clustering. Approximately 1,400 genes were selected from the total data set based on variance more than 3-fold in at least two arrays. The site of origin of each fibroblast culture is indicated and color-coded. Fibroblasts cultured in minimal-serum medium (0.1% FCS) are indicated by black dots below the dendrogram. (B) Supervised hierarchical clustering of cultured fibroblasts was performed by using approximately 1,600 genes identified by SAM (9) that varied according to fibroblast site of origin. Serum-starved samples are indicated by black dots below the dendrogram. (C) Topography transcriptome of fibroblasts. The variation in expression of approximately 1,600 genes described in B are shown in matrix format (8). The scale extends from 0.25- to 4-fold over mean (−2 to +2 in log2 space) as is indicated on the bottom. Gray represents missing data. Gene clusters are indicated on the right.

