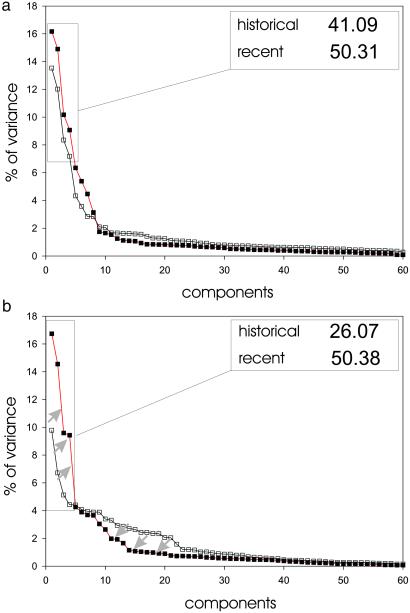
Figure 3.
Variance spectra for the series in Fig. 1. (a) SOI. (b) Cholera. White and black squares refer to past and present intervals, respectively. The relative variance accounted for by the four reconstructed components of Fig. 2 is shown separately for the historical and present periods in Inset. Gray arrows in b indicate the changes occurring in the different portions of the spectra. For all analyses, a window length of 60 months was selected to be able to isolate the typical temporal scales of El Niño.

