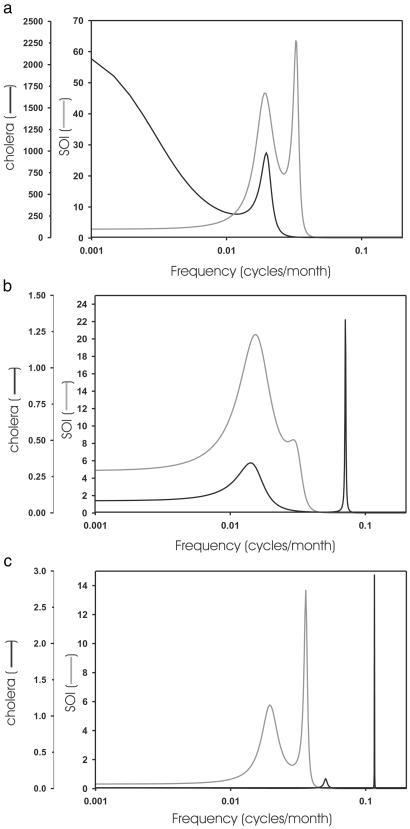
Figure 4.
Frequency spectra computed for the reconstructed time series of cholera and SOI of Fig. 2, for the present (a) and past divided into two periods, 1893–1920 (b) and 1920–1940 (c). The frequency spectra were obtained with the MEM. During the last 2 decades, a quasiquadrennial cycle is present for both ENSO and cholera which closely matches in frequency (a). This correspondence is also seen for the first part of the historical record (b: main period at 6.5 yr) but disappears with no clear dominant frequency in the interannual variability of cholera in the later part (c). The spectrum of SOI for the present shows a more important contribution of the 4–5 yr range. This part of the spectrum weakens around 1920 (c). (For consistency, results were crosschecked with those from the multitaper method spectrum analysis).

