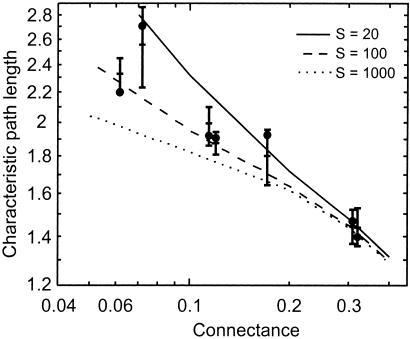
Figure 1.
Characteristic path length D of the seven empirical webs listed in Table 1 (●), error bars showing mean ± 2 SD for niche model webs with the same S and C as the empirical webs, and curves showing mean D vs. C for niche model webs with S = 20, 100, and 1,000. Log-log plot shows the approximate power-law relationship between mean D of niche model webs and C for all S. The seven empirical webs are, from left to right, Ythan Estuary (S = 78), Chesapeake Bay (S = 31), St. Martin Island (S = 42), Little Rock Lake (S = 92), Bridge Brook Lake (S = 25), Coachella Valley (S = 29), and Skipwith Pond (S = 25). Because the niche model is a stochastic model, previously described Monte Carlo techniques (5) were used to measure the mean and SD of the niche model predictions, and errors are normalized by the SD of the model prediction (Table 1). The mean normalized error is −0.02 model SD, which is very close to zero as expected when the model fits the data. The SD of the errors is 1.4, showing slightly greater variability of normalized error than the theoretically expected SD of 1 (5). A null model that randomly arranges trophic links while maintaining empirically observed S and C (5) fits the data much worse as indicated by a normalized error mean of −2.6 and SD of 5.4.

