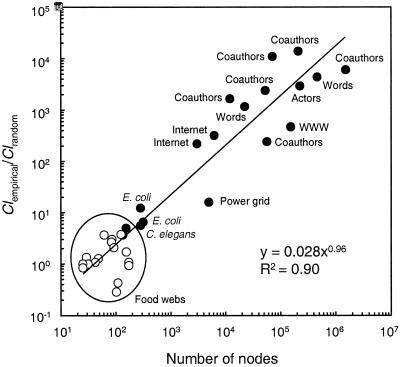
Figure 1.
Log–log plot of the clustering coefficient ratios (empirical/random web values) as a function of size of the network. Open circles represent data from 16 trophic food webs from the current analysis. Dark circles represent data from previous studies of 18 scale-free small-world networks summarized in ref. 19: 2 taxonomic food webs (22); E. coli substrate and reaction graphs (40); C. elegans neural network, movie actors, and power grid (17); 4 science coauthorship data sets (41, 42); 2 math and science coathorship data sets (43); low and high estimates for Internet domains (44, 45); world wide web sites (46); and concurrence and synonomy of words (47, 44).

