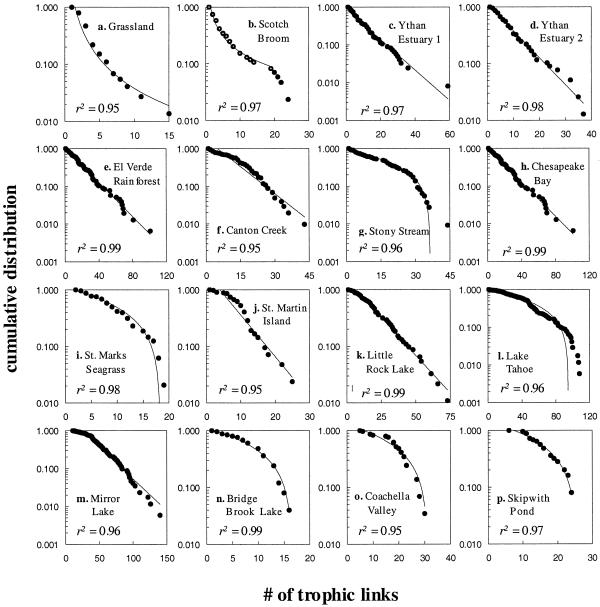
Figure 2.
Linear-log plots of the cumulative distributions of links per species (both predator and prey links) in 16 food webs. Webs are ordered by increasing connectance (see Table 1). Lines and r2 values show the fit to the data of the best of three simple models: power–law distribution (upward curved line), exponential decay (straight line), or uniform distribution (downward curved line). No food web is well fit by a Poissonian or Gaussian distribution.

